Introduction: Why the Cost of Quality Matters More Than Most Manufacturers Realize
Many manufacturers underestimate how much quality really costs. Studies commonly estimate that the cost of quality can range from 15% to 20% of sales, and in weaker systems, the total can be even higher once hidden losses are included. That matters because most plants only see the obvious part: scrap, rework, and rejected parts on the shop floor.
In simple terms, the cost of quality includes all the money you spend to achieve quality and all the money you lose when quality fails. That is different from the cost of poor quality, which refers specifically to losses caused by defects, errors, failures, and customer issues. If your team only tracks visible failure costs, you miss the full financial picture and risk making the wrong improvement priorities.
For quality managers, plant leaders, operations teams, finance, and continuous improvement managers, this is not just a reporting metric. It affects margin, machine capacity, delivery performance, warranty exposure, and customer trust. In this article, you will see how quality costs are categorized, what should be included in a practical analysis, how to measure poor quality costs accurately, and how manufacturers can build a more reliable tracking process to support better decisions.
The Four Quality Cost Categories in Manufacturing
Manufacturers usually group the cost of quality into four standard buckets: prevention costs, appraisal costs, internal failure costs, and external failure costs. This framework matters because the same underlying issue can generate very different losses depending on when it is detected and how far it travels through the process. In practice, a sound quality cost analysis helps you separate money spent to avoid defects from money lost because defects were not prevented early enough.
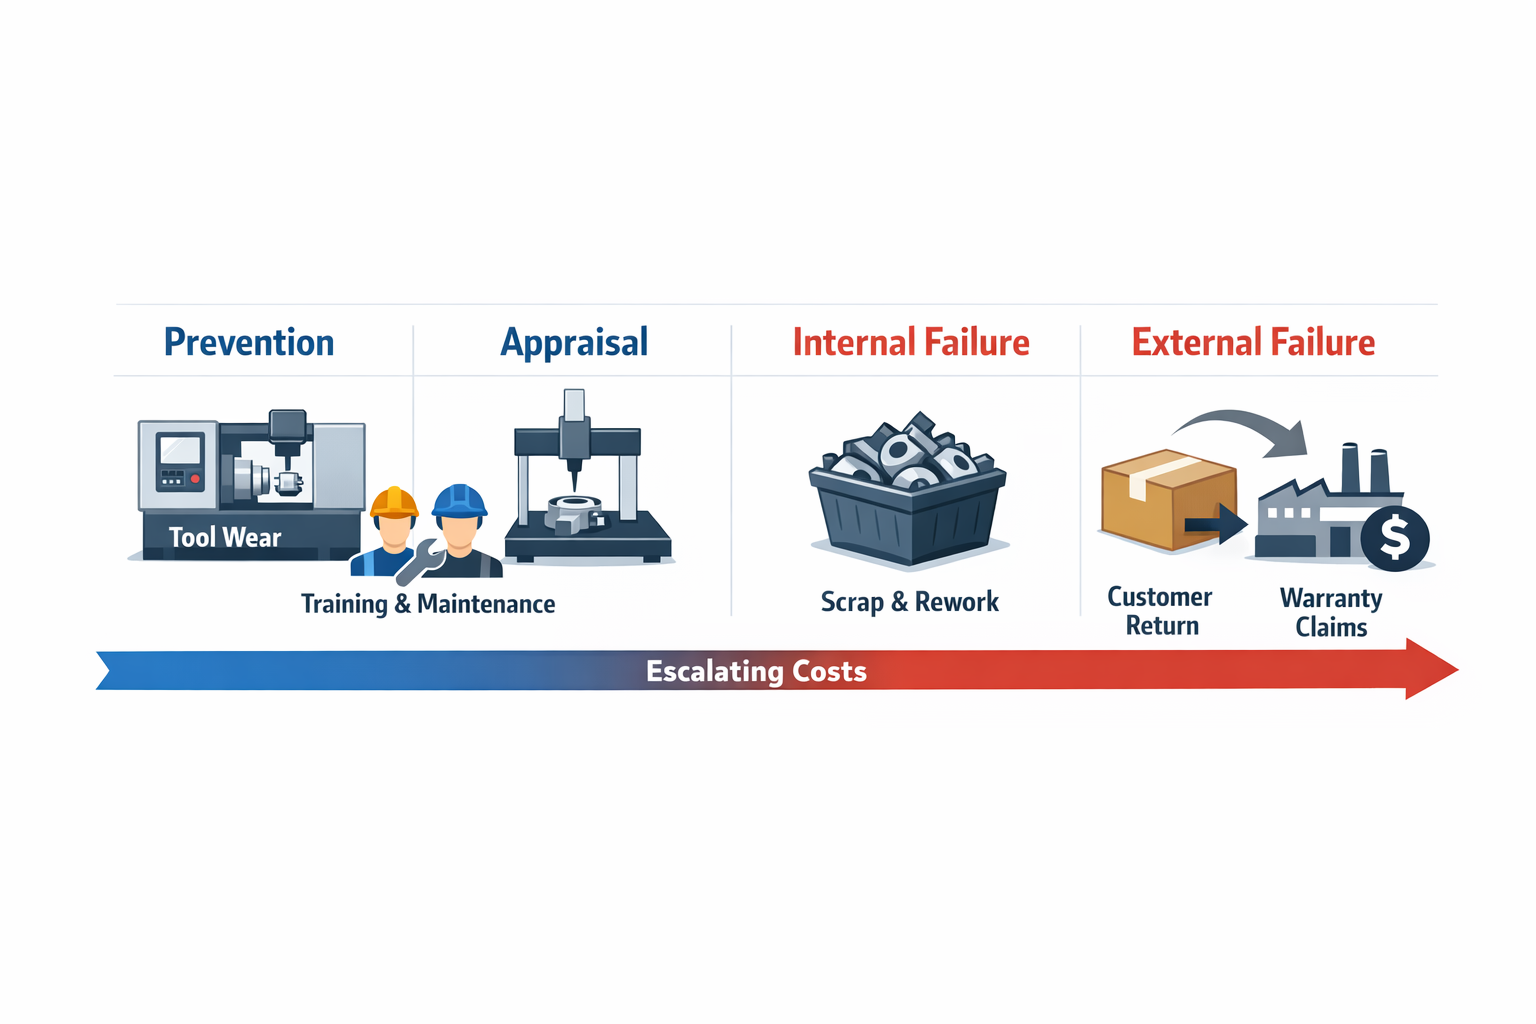
To make the categories concrete, consider one running example: a metal parts factory producing precision valve housings. A tool wear issue begins to push a critical bore dimension out of tolerance. If the factory trains operators to detect wear trends, that is a prevention cost; if inspectors catch the defect before shipment, that becomes appraisal plus internal failure cost; if the parts reach the customer and trigger returns, warranty claims, or line stoppages, the same issue has now moved into external failure cost.
Prevention Costs
Prevention costs are the planned investments made to stop defects before they happen. In manufacturing, this includes operator training, control plan development, preventive maintenance, gauge calibration planning, process capability studies, mistake-proofing, supplier quality development, and first-article setup discipline. These are not waste costs; they are the controlled costs of building a more stable process.
In the valve housing example, the plant may spend on tool life standards, setup verification training, and scheduled spindle checks to prevent bore drift. It may also introduce a poka-yoke for the wrong tool offset and require sign-off when inserts are changed. Those actions consume labor and resources, but they reduce future failure costs and usually lower the total cost of poor quality over time.
Appraisal Costs
Appraisal costs are the costs of checking whether the process and product meet requirements. Typical examples include incoming inspection, in-process inspection, final inspection, test runs, lab testing, audit time, and the labor used to review measurement records. These costs exist because the business needs evidence that quality controls are working.
In the same factory, once bore variation becomes a known risk, the team may add hourly dimensional checks, increase CMM sampling, or perform 100% inspection on the affected lot. Those activities belong in appraisal, not failure, because they are about detection and verification. However, a higher appraisal cost can also be a warning sign that the process is not yet stable enough and is relying too heavily on inspection.
Internal Failure Costs
Internal failure costs occur when defects are found before the product reaches the customer. In manufacturing, this is often the most visible bucket because it includes scrap, rework, retesting, sorting, downtime tied to quality issues, and yield loss. It can also include extra machine hours and labor consumed to recover from the defect.
In the valve housing case, inspectors catch out-of-tolerance parts before shipment, and the factory scraps some units while reworking others through secondary boring and retesting. Production control then reschedules the line to recover lost output, while maintenance checks the tooling system, and supervisors review the batch history. All of that sits under internal failure cost because the defect stayed inside the factory, even though the financial impact may already be significant.
External Failure Costs
External failure costs start once the defect escapes to the customer. This category includes returns, complaint handling, warranty claims, field service visits, replacement shipments, penalties, and the internal time required to investigate and respond. In some industries, external failures also trigger regulatory exposure or customer chargebacks.
If the valve housings are shipped and later rejected by the customer during assembly, the cost profile changes sharply. The manufacturer may now pay return freight, sorting support at the customer site, replacement production, account management time, and possible debit notes for line disruption. Among all quality cost categories, external failure is usually the most damaging because it combines direct financial loss with harder-to-measure commercial risk.
Why the Categories Need to Stay Distinct
Teams often mix these categories, which makes the data less useful for decision-making. For example, adding more inspectors is not the same as reducing defects, and rework labor should not be hidden inside normal production costs. If you want to manage the cost of quality properly, each category needs clear rules so leaders can see whether they are paying to prevent problems, detect them, or absorb the consequences after failure.
Used correctly, the four-category model shows where money is going and where improvement will pay back fastest. A plant with rising appraisal cost may need better process control, while a plant with high internal failure may need tighter setup discipline or supplier control. A plant with recurring external failure costs has a containment problem that is already affecting the customer.
What Counts in Quality Cost Analysis
A practical quality cost analysis starts by translating quality events into cost elements the business already understands. Instead of stopping at defect counts or scrap percentages, you need to map each issue to labor hours, material loss, machine time, logistics expense, and customer-facing impact. This is where many manufacturers understate the true cost of quality, especially when quality, production, and finance track losses in separate systems. The goal is not to create a perfect accounting model on day one, but to build a repeatable method that captures the highest and most controllable costs.
Direct vs. Hidden Quality Costs
Direct quality costs are the losses that are easy to see and book quickly, such as scrapped raw material, rework labor, replacement parts, inspection time, and warranty payouts. Hidden costs are usually spread across departments and, therefore, missed in standard manufacturing reports. These include quarantined inventory that cannot ship, production rescheduling, overtime to recover output, engineering investigation time, supplier follow-up, and expedited freight to protect delivery performance. If you only measure visible failure costs, your quality cost categories will look smaller than the operational damage they actually create.
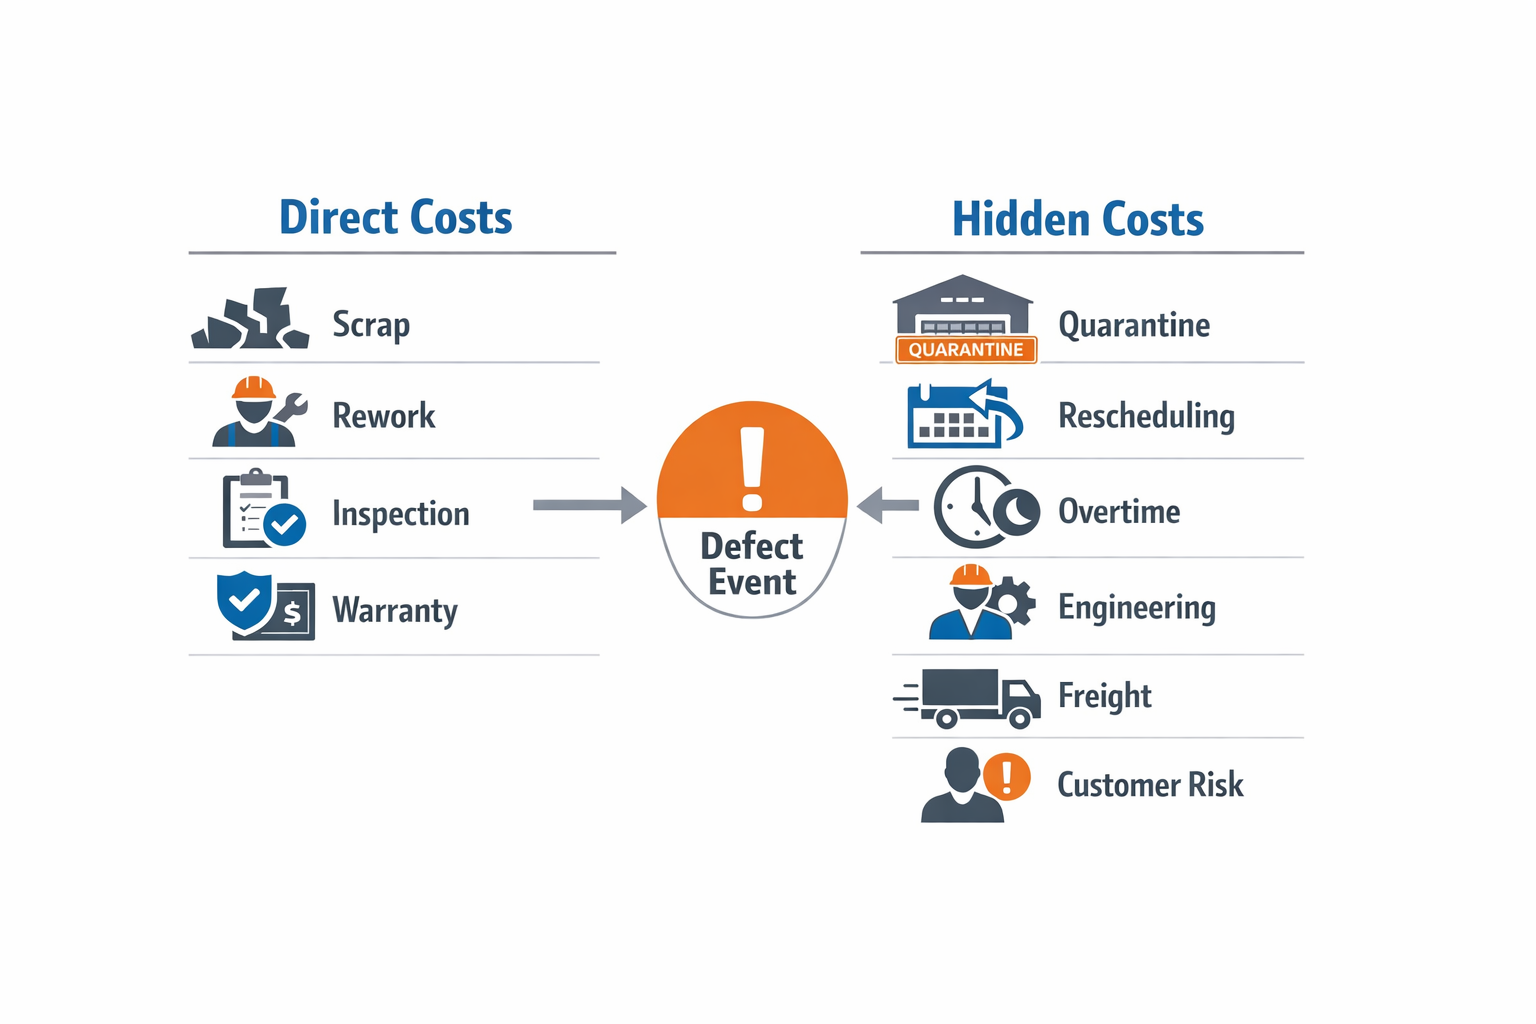
A useful rule is to ask two questions for every quality event: What did this defect consume directly? And what else did it disrupt? The first question captures immediate losses, while the second reveals the downstream operational and customer impact. This approach helps quality managers and finance teams avoid treating quality cost analysis as a narrow scrap exercise. It also makes prevention costs and appraisal costs easier to justify, because the baseline failure cost is more complete.
Map Cost Sources by Resource Type
The cleanest way to structure a real analysis is to group losses by resource type rather than by department alone. Labor should include operators, inspectors, technicians, engineers, and supervisors involved in containment, rework, review, and follow-up. Materials should cover not just scrapped parts, but also consumed packaging, test samples, replacement components, and obsolete work-in-process. Machine time should reflect lost production capacity, extra setup time, retesting cycles, and downtime caused by defect handling.
Logistics and external service costs often sit outside the quality budget, but they belong in the analysis when they are triggered by a quality event. That includes return freight, emergency shipments, third-party sorting, field service visits, and disposal fees. Customer-facing losses are harder to quantify, but they matter because they affect future revenue and account risk. In practice, many plants begin by measuring only confirmed items and then add estimated rules for recurring external failure patterns.
Build Cost Rules Before You Chase Precision
Most plants already have enough data to improve their quality cost analysis, but they lack agreed rules for assigning costs consistently. A better approach is to define standard values for common events, such as hourly rework labor rates, machine-hour loss rates, inspection cost per batch, or standard expedited freight categories. That creates a usable view of failure costs without waiting for finance to manually validate every incident. Over time, you can refine the model and align it more closely with plant accounting.
The most useful analysis is the one that helps you compare problems and decide where action will pay back fastest. If one defect type generates moderate scrap but repeatedly causes line disruption, quarantine, and premium shipment, it may deserve higher priority than a more visible scrap issue. That is why a real cost of quality review should connect quality events to operational consumption, not just to what appears on a nonconformance report.
How to Measure Cost of Quality
Start With a Clear Event Definition and Owner
To measure the cost of quality reliably, you need to define exactly what triggers a record. In practice, that means naming the events that create measurable loss: scrap, rework, line stoppage due to defects, supplier nonconformance, customer returns, warranty claims, and sorting activity. Each event should have one owner responsible for the first capture, even if several departments contribute costs later. Without that rule, your quality cost analysis quickly turns into partial reporting and duplicate entries.
Take a stamped metal component line as a running example. An operator finds a dimensional defect during in-process inspection and raises a nonconformance record for the affected batch. Production owns the initial event entry, quality owns defect validation and disposition, and finance later validates the monetary impact rules. That ownership chain is what turns a defect from a shop-floor issue into usable COPQ manufacturing data.
Set Cost Rules Before You Start Reporting
Most manufacturers fail at measuring costs because they start collecting incidents before agreeing on how to price them. For each event type, define the cost formula in advance: material loss, direct labor time, machine time, tooling impact, inspection labor, freight, and any external recovery cost. You should also decide which losses are booked as actuals, which are estimated at standard rates, and which require finance review before month-end closure. This keeps the numbers comparable across lines, plants, and reporting periods.
In the metal component example, the defect batch is split into three cost elements. Scrap parts are valued at standard material and conversion cost, rework is priced by labor minutes and machine time, and blocked inventory is assigned a holding value until final disposition. If a supervisor can override these rules without reason codes, your quality cost categories become inconsistent and trend analysis loses credibility.
Map Where the Data Actually Lives
No single department holds the full cost of quality picture, especially when you are measuring poor quality across the full workflow. Production logs scrap quantity and downtime, quality records defect type and disposition, maintenance confirms whether equipment conditions contributed, supplier management tracks incoming material issues, customer service logs complaints and returns, and finance validates standard rates, credits, and write-offs. Good measurement depends on linking these records, not asking one team to estimate everything after the fact.
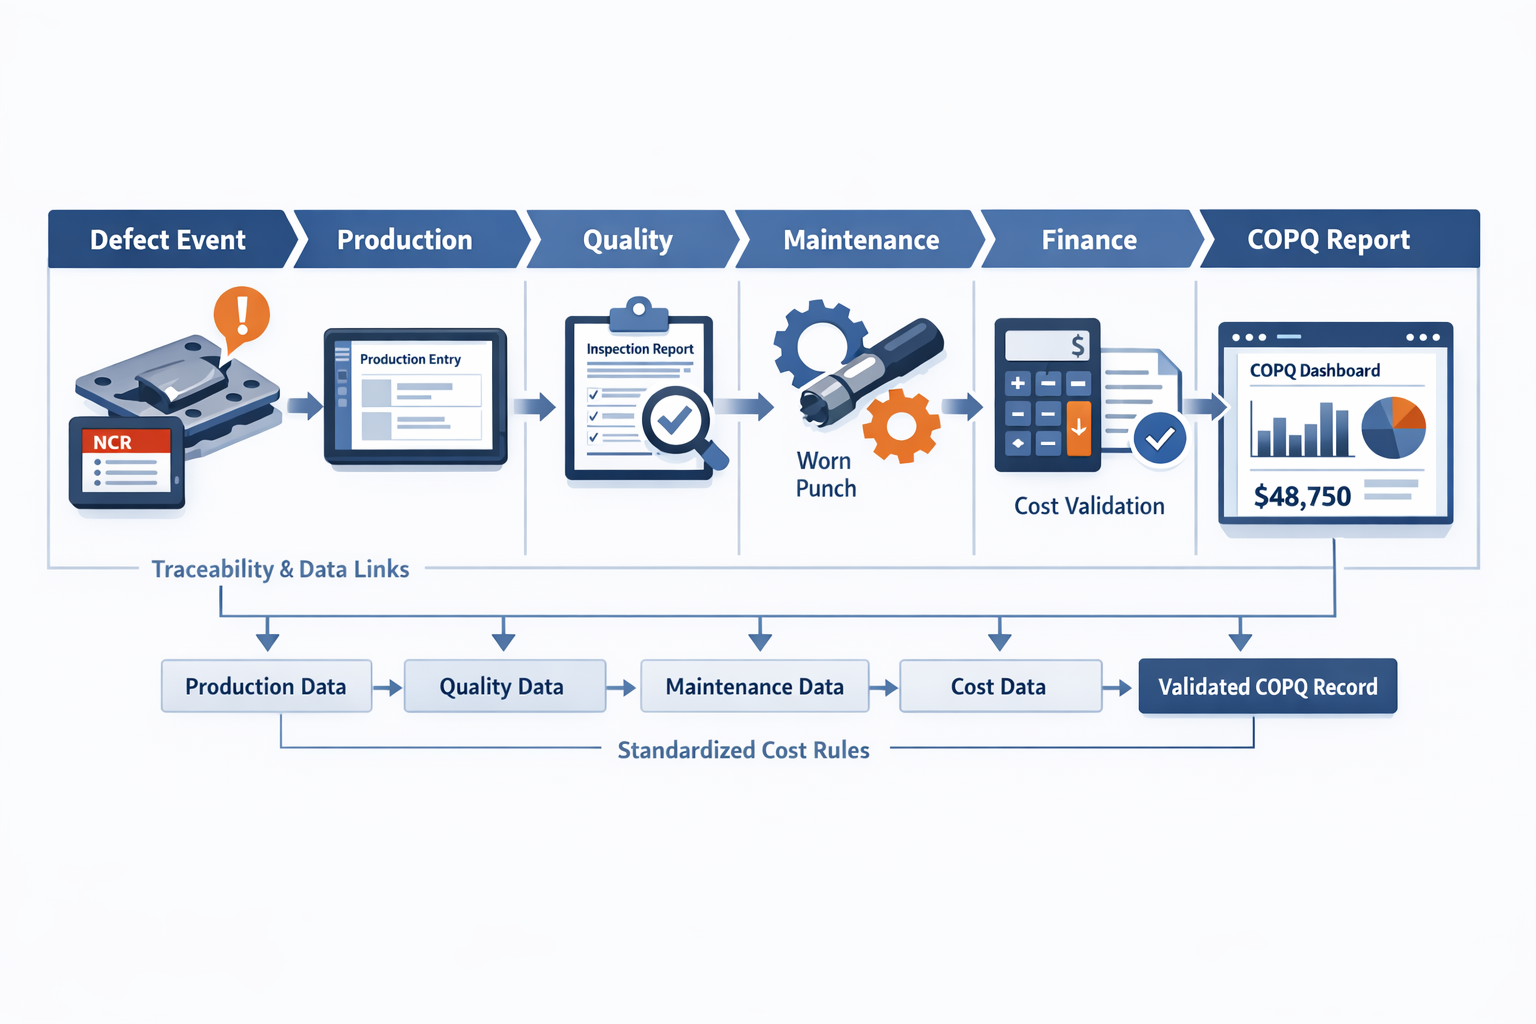
In the running example, the operator’s defect report starts in production, but the total loss only becomes visible after other teams add data. Quality confirms that 1,200 pieces are suspect, maintenance finds punch wear that increased variation, and finance applies the approved rates for scrap, rework, and lost machine time. That cross-functional trail is why a proper quality cost analysis is more accurate than a month-end spreadsheet summary.
Choose Reporting Frequency and Roll-Up Logic
A useful COPQ process does not wait until quarter-end. Event capture should happen in real time or by shift, supervisor review should happen daily, and cost validation should happen weekly or at least before month close. Then you can roll data up by line, product family, defect code, supplier, customer, or plant, depending on who will use it for decisions.
In the same example, the plant records the dimensional defect on the shift it occurred, quality reviews the batch within the day, and finance validates the largest losses in the weekly operations review. At month-end, the event is rolled into reports by defect mode and stamping press so managers can see whether the biggest quality cost categories are driven by process control, incoming material, or equipment wear. That is what makes prevention costs and appraisal costs easier to prioritize later.
Validate Before Publishing the Numbers
If COPQ data is going to influence capital requests, supplier escalation, or improvement projects, it needs a validation step. The simplest approach is a threshold-based review where small losses auto-post using standard rules, while larger losses require confirmation from quality, operations, and finance. This avoids endless approval cycles while still protecting the accuracy of high-impact reports. It also improves trust in the numbers when failure costs are compared across departments.
For the metal component defect, a minor rework event might post automatically, but a major batch rejection with expedited replacement production should require review. Quality confirms the root defect and containment scope, operations confirms downtime and recovery hours, and finance signs off on the final loss value. Only then should the event feed plant-level cost of quality reporting.
Why Spreadsheet-Based COPQ Reporting Breaks Down
Spreadsheets usually fail for three reasons: inconsistent categories, late data entry, and weak traceability. One plant may classify sorting labor as appraisal, another as internal failure, and a third may not record it at all. By the time someone consolidates the files, key details such as defect source, affected lot, downtime minutes, and approval history are already missing. The result is a COPQ number that looks precise but cannot support action.
In the running example, if production tracks scrap in one file, quality tracks NCRs in another, and finance applies monthly estimates in a third, the final report will almost certainly understate the true loss. Rework labor may be missed, machine stoppage may be rounded away, and supplier recovery may never be tied back to the original defect. Measuring the cost of quality well is less about building a complex model and more about creating a disciplined, repeatable data chain from defect capture to validated loss reporting.
How Jodoo Helps Manufacturers Track and Reduce Quality Costs
Build Quality Cost Tracking Around Real Factory Workflows
Jodoo helps manufacturers turn quality events into structured, traceable records instead of disconnected emails, paper forms, and spreadsheet updates. Using no-code forms and workflows, you can capture NCRs, scrap reports, rework logs, CAPA actions, supplier complaints, and customer return cases in one connected system. That makes it easier to classify losses consistently across prevention, appraisal, and failure costs without waiting for a long MES or QMS implementation. For teams doing quality cost analysis, the practical value is simple: the data is captured where the event happens and stays linked as the issue moves through containment, correction, and review.
A typical setup starts with standardized forms for each event type. An NCR form can record defect code, product, line, shift, supplier lot, quantity affected, and containment action, while a rework log can add labor hours, parts consumed, and retest results. Scrap records can calculate material loss automatically, and CAPA tasks can assign owners, due dates, and evidence requirements for closure. Because the fields and logic are configurable, each plant can reflect its own approval structure and defect taxonomy while still keeping enterprise-level reporting consistent.
Standardize Classification So COPQ Data Is Comparable
One of the biggest issues in COPQ manufacturing programs is not data volume but category inconsistency. If one line records “rework” as maintenance loss, another records it as quality loss, and a third does not log labor at all, your cost of quality numbers will not support good decisions. Jodoo can enforce classification rules through required fields, conditional logic, and workflow checks, so every record follows the same cost model before it is submitted or approved. That gives quality, operations, and finance teams a more reliable way to compare plants, products, suppliers, and defect types.
You can also separate operational inputs from financial validation without creating extra manual work. Production or quality teams enter the event details first, then supervisors, engineers, or finance reviewers confirm quantities, labor rates, material values, freight charges, or customer debit amounts through workflow steps. This is useful when a defect touches multiple quality cost categories, such as appraisal costs for additional inspection and failure costs for scrap or returns. Instead of estimating later from memory, the system builds the cost record progressively as facts become available.
Connect the Workflow From Defect Capture to Cost Dashboard
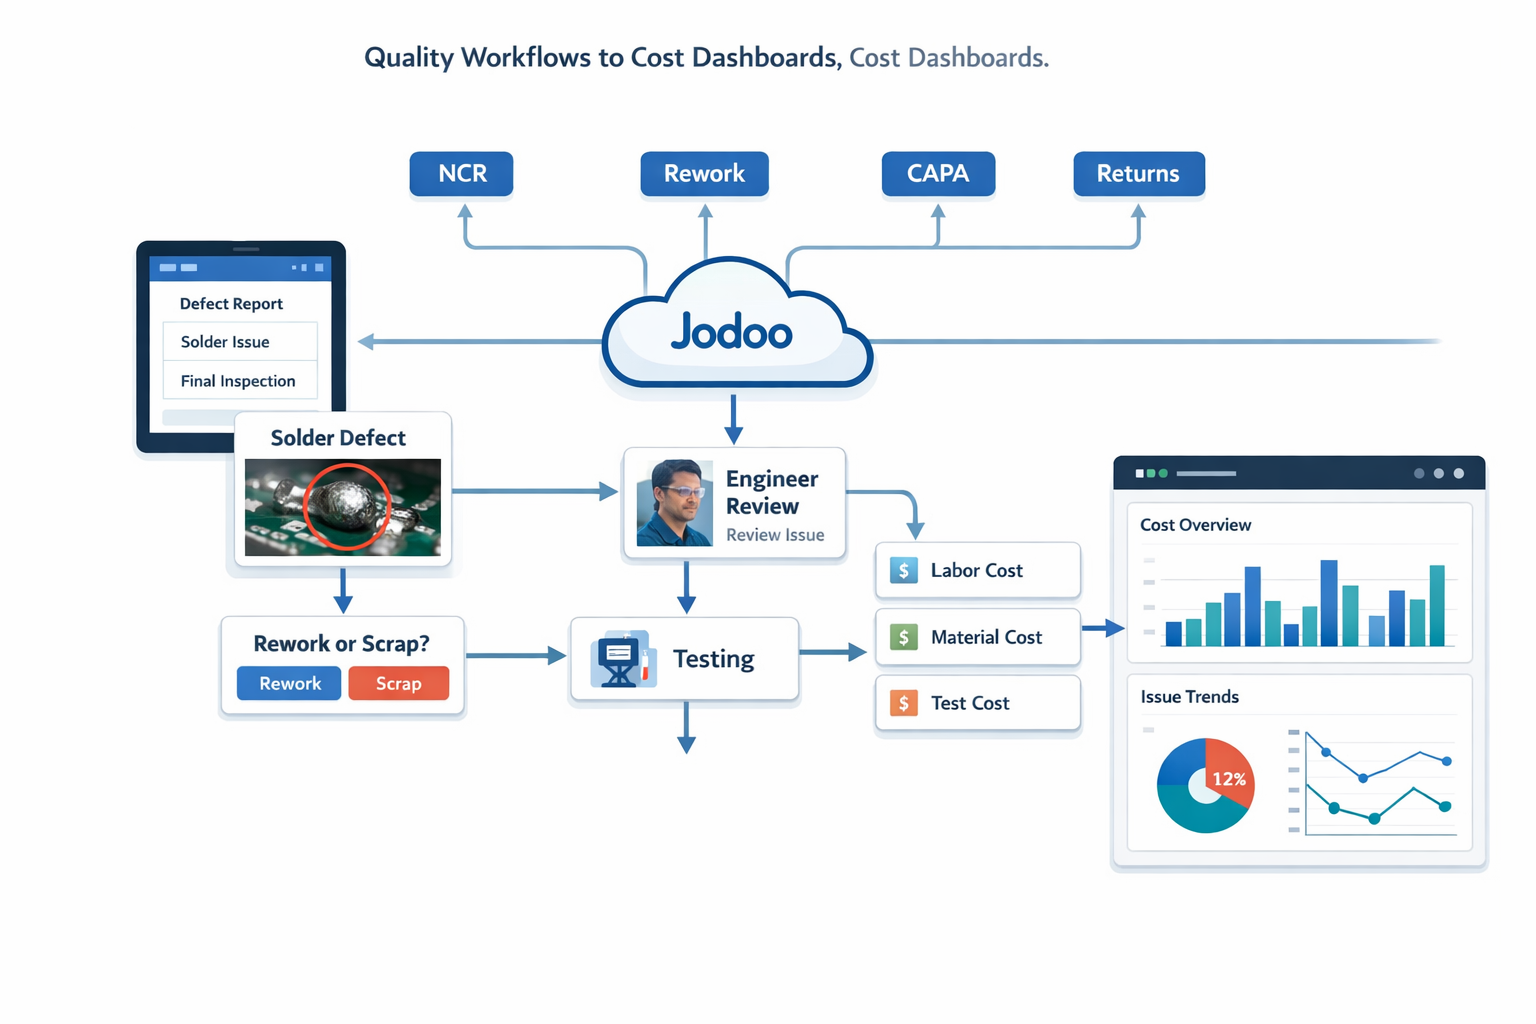
Consider an electronics manufacturer assembling control boards for industrial equipment. An operator finds soldering defects during final inspection and submits an NCR from a tablet, including defect photos, SKU, batch number, quantity affected, and initial disposition. The workflow then routes the case to the line quality engineer, who decides whether the affected boards should be reworked, scrapped, or held for engineering review. From there, linked records capture rework labor time, replacement components, additional testing effort, and any downstream customer return tied to the same batch.
Because Jodoo links these records in one workflow, managers do not have to reconcile five different files to understand the total loss. The system can roll up direct material loss, technician hours, inspection effort, and return-related costs into one case-level view, then aggregate the same data by plant, line, product family, customer, or supplier. That makes it much easier to see which failure costs are isolated exceptions and which ones justify a corrective action project or supplier escalation.
Use Dashboards to Prioritize What to Fix First
Once event data is structured, Jodoo dashboards can show quality cost trends in a way that plant and finance leaders can act on quickly. You can track the total cost of quality by month, internal versus external failure costs, rework cost per product family, top defect modes by loss value, or supplier-related quality losses by site. Instead of ranking problems only by defect count or ppm, teams can prioritize by financial impact, which often changes the improvement sequence. A defect that happens less often may still deserve faster action if it drives expensive customer returns or high rework labor.
In the electronics example, managers may discover that solder bridging generates more incidents, but connector misalignment creates higher total losses because it triggers retesting, delayed shipments, and customer returns. That insight changes where engineering time should go first. With role-based dashboards, plant managers can monitor line-level trends, quality leaders can review CAPA effectiveness, and finance can validate whether the reported savings from corrective actions are actually reducing cost over time. This supports better decisions on where to invest in prevention costs and where tighter appraisal controls are still necessary.
Start With One Process, Then Expand
Most manufacturers do not need to digitize every quality process at once to get value. A common approach is to start with one high-friction workflow, such as NCR and rework tracking, then extend it to supplier quality issues, customer complaints, and CAPA follow-up once the data structure is stable. Jodoo is well-suited to this staged rollout because operations teams can configure forms, approval paths, notifications, and dashboards without heavy custom development. That shortens the time between identifying a reporting gap and putting a usable control process in place.
If your goal is to reduce the cost of quality, speed matters as much as reporting depth. A flexible system helps you capture the right data early, standardize how losses are measured, and give managers visibility before quality costs become normalized. Jodoo gives manufacturers a practical way to build that system around their actual workflows rather than forcing teams to wait for a complex software project.
Conclusion: Turn Cost of Quality Data Into Better Improvement Decisions
The cost of quality matters because it shows where profit is being protected and where it is quietly leaking out of the operation. When manufacturers measure prevention, appraisal, internal failure, and external failure costs in one view, they can stop treating every quality issue as equally urgent. That leads to better decisions on where to invest first, whether in process control, operator training, supplier development, inspection changes, or corrective action.
The real value of quality cost tracking is not a monthly report for management. It is the ability to prioritize the few problems that create the biggest financial impact across scrap, rework, downtime, returns, warranty exposure, and customer risk. For many plants, that also means moving beyond fragmented spreadsheets that make quality losses hard to validate, compare, and act on across departments or sites.
If you want a more practical way to capture and reduce quality costs, Jodoo gives manufacturing teams a no-code lean manufacturing platform to digitize NCRs, rework logs, CAPA workflows, supplier issues, and real-time cost dashboards in one system. You can start a free trial or book a demo to see how Jodoo can help your team scale improvement across plants.