Nach Kategorien durchsuchen

Einleitung: Warum die Reaktionszeit bei der Instandhaltung wichtiger ist, als den meisten Werken bewusst ist
Eine Produktionslinie verliert nicht nur dann an Produktion, wenn eine Maschine ausfällt. Sie verliert auch an Produktion, während alle auf die Reaktion der zuständigen Person warten. In vielen Werken, Reaktionszeit der Wartung Die versteckte Lücke zwischen der Meldung einer Störung und dem tatsächlichen Beginn der Reparaturarbeiten führt schnell zu Produktionsausfällen, Lieferverzögerungen und einem zunehmenden Druck auf die Wartungs- und Produktionsteams.
Diese Kennzahl ist wichtig, da Ausfallzeiten selten nur ein technisches Problem darstellen. Ein kurzer Stillstand an einer Abfüllanlage, einer CNC-Zelle oder einer Verpackungsmaschine kann die Personaleinsatzplanung durcheinanderbringen, Umrüstungen verzögern und Lieferengpässe für die gesamte Schicht verursachen. Branchenstudien schätzen die Kosten ungeplanter Ausfallzeiten häufig auf Tausende von Dollar pro Stunde, und in Betrieben mit hohem Produktionsvolumen können diese Kosten deutlich höher liegen. Dennoch konzentrieren sich viele Betriebe immer noch nur auf die Reparaturdauer, anstatt darauf, wie lange es dauert, das Problem zu erkennen, einen Techniker zuzuweisen und die Arbeiten aufzunehmen.
Genau dieses praktische Problem behandelt dieser Artikel. Sie erfahren, wie Sie die Reaktionszeit korrekt messen, die tatsächlichen Ursachen von Verzögerungen identifizieren und praktische Workflow-Änderungen umsetzen, um Wartungsverzögerungen zu reduzieren, bevor diese zu Produktionsausfällen führen.
Was die Reaktionszeit im Wartungsbereich umfasst – und wie man sie genau misst
Reaktionszeit in messbare Zeitstempel unterteilen
Wenn Sie messen möchten Reaktionszeit der Wartung Genau genommen benötigen Sie mehr als einen Start- und Endzeitpunkt. In den meisten Anlagen handelt es sich bei der Verzögerung nicht um einen einzelnen Zeitabschnitt, sondern um eine Kette kurzer Wartezeiten zwischen Meldung, Priorisierung, Zuweisung und Ankunft. Durch die Aufteilung des Prozesses in klare Meilensteine erkennen Sie, wo Zeit verloren geht und welcher Teil des Arbeitsablaufs zuerst Aufmerksamkeit erfordert.
Verwenden Sie für jede Störung oder dringende Wartungsanfrage eine einfache Zeitstempelsequenz: Anfrage gestellt, Anfrage bestätigt, Techniker zugewiesen, Techniker eingetroffen und Problem behoben. Einige Werke erfassen zusätzlich die Genehmigung, die Teileausgabe oder den Neustart der Maschine, wenn diese Schritte regelmäßig die Reaktionszeit beeinflussen. Der optimale Detaillierungsgrad hängt von Ihrem Betrieb ab, die Sequenz muss jedoch über alle Linien und Schichten hinweg einheitlich sein, um verlässliche Trenddaten zu erhalten.
Reaktionszeit, Reparaturzeit und Lösungszeit trennen
Ein häufiges Messproblem besteht darin, dass Pflanzen mehrere verschiedene Intervalle zu einer einzigen Zahl vermischen. Reaktionszeit der Wartung bezeichnet üblicherweise den Zeitraum von der Meldung des Problems bis zum Zeitpunkt, an dem der Techniker physisch reagiert oder vor Ort ist, je nach Ihrer internen Definition. Reparaturzeit ist die praktische Wartungsarbeit von der Ankunft oder dem Reparaturbeginn bis zum Abschluss, während Gesamtauflösungszeit Umfasst den gesamten Zeitraum von der Meldung bis zum Abschluss des Problems und der Wiederherstellung der Ausrüstung.
Am Beispiel der Verpackungslinie könnte man die Reaktionszeit mit 10:02 bis 10:14 Uhr = 12 Minuten, die Reparaturzeit mit 10:14 bis 10:32 Uhr = 18 Minuten und die gesamte Lösungszeit mit 10:02 bis 10:32 Uhr = 30 Minuten definieren. Wenn man nur die Gesamtzeit von 30 Minuten erfasst, lässt sich nicht feststellen, ob das eigentliche Problem eine langsame Auslieferung oder eine technisch anspruchsvolle Reparatur war. Deshalb fragen sich Unternehmen, wie sie die Reaktionszeit messen können. Reaktionszeit der Wartung Sie sollten jedes Intervall separat definieren, bevor sie Teams, Ressourcen oder Schichten vergleichen.
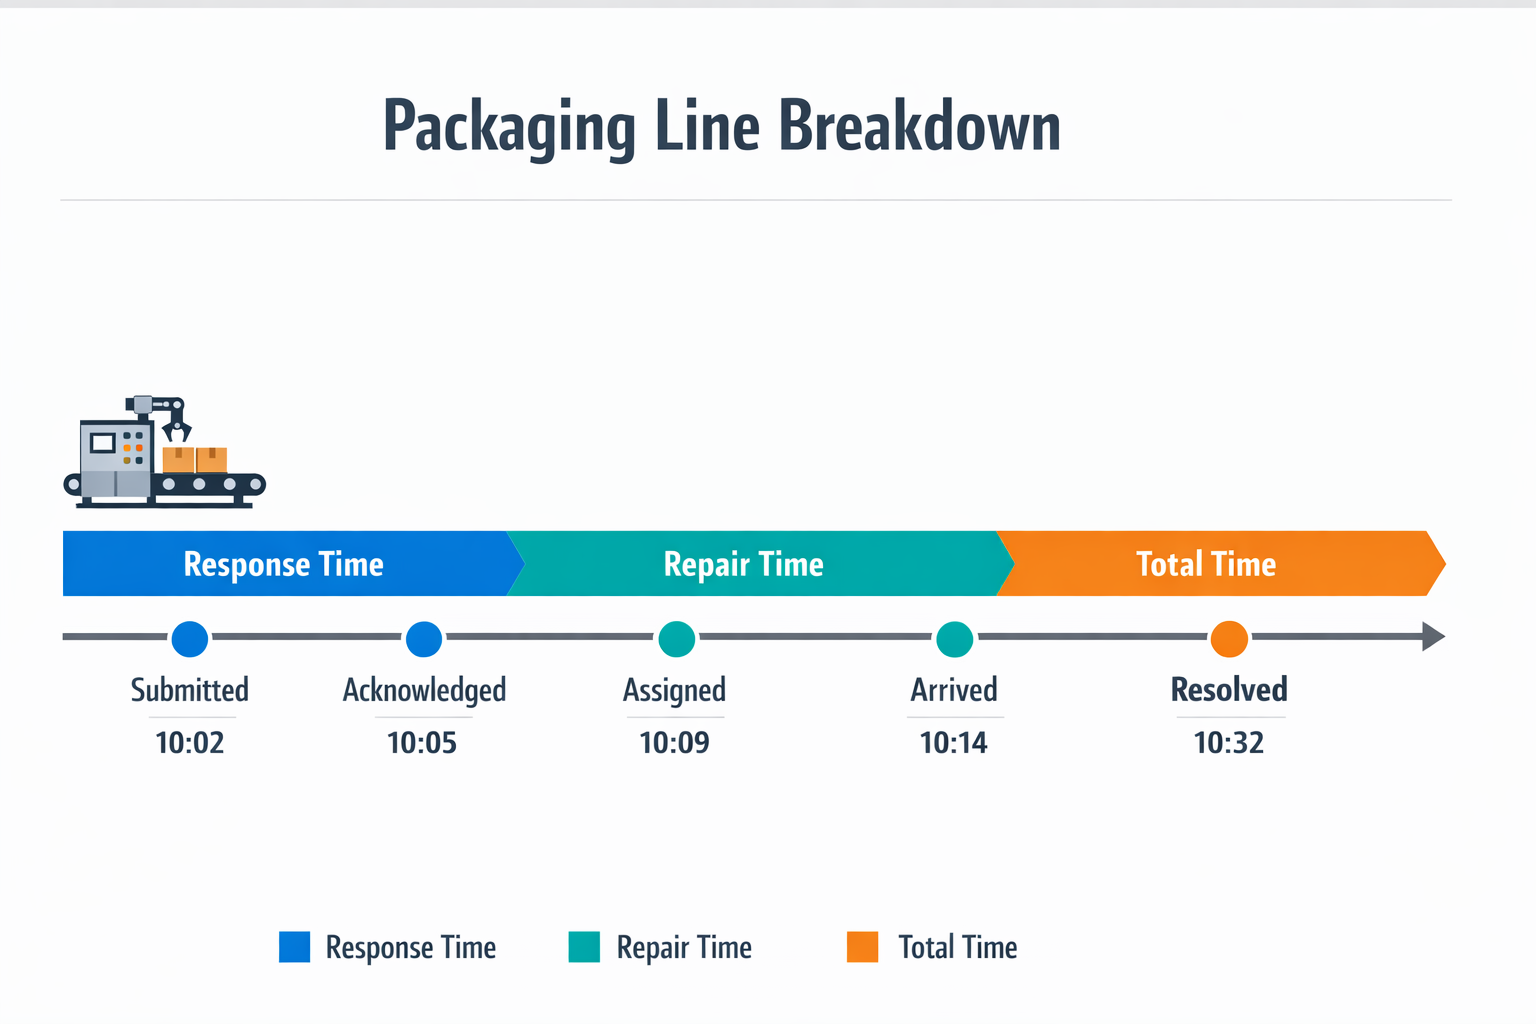
Die richtigen KPIs verfolgen und die Daten nutzen, um Engpässe zu lokalisieren.
Die nützlichste Wartung KPIs Jeder Manager sollte die mit jeder Phase der Reaktionskette verbundenen Daten erfassen. Beginnen Sie mit der Zeit von der Auftragsbestätigung bis zur ersten Prüfung, der Zuweisungszeit von der Auftragsbestätigung bis zum Einsatz des Technikers und der Reise- oder Ankunftszeit von der Zuweisung bis zum Eintreffen des Technikers. Erfassen Sie anschließend die Reparaturdauer und die gesamte Bearbeitungszeit, um Verzögerungen im Arbeitsablauf von der eigentlichen Wartungsdurchführung zu trennen.
Sobald die Zeitstempel der einzelnen Phasen erfasst sind, lassen sich Muster leichter erkennen. Reagiert ein Techniker nur in der Nachtschicht langsam, liegt das Problem möglicherweise eher an einer unzureichenden Eskalationsabdeckung als an mangelnder Kompetenz der Techniker. Erfolgt die Zuweisung schnell, die Ankunft jedoch langsam, kann dies eher an der Zoneneinteilung der Techniker, der Anfahrtsstrecke oder einer unklaren Priorisierung der Leitungen liegen als am Personalbestand.
Hier erweist sich die Messung als wertvoller als die Intuition. Viele Betriebe gehen fälschlicherweise davon aus, mehr Techniker zu benötigen, obwohl die Daten Verzögerungen bei der Genehmigung, unvollständige Anfragen oder eine ineffiziente Auftragsabwicklung aufzeigen. Später, bei der Entwicklung von Strategien zur Reduzierung dieser Verzögerungen, wird dies deutlich. Reaktionszeit der Wartung, Diese KPIs auf Zeitstempelebene zeigen an, welche Prozessänderungen voraussichtlich die schnellste Verbesserung bringen werden.
Die verborgenen Ursachen für langsame Reaktionen in der Pflanzenproduktion
Unklare Meldewege verlangsamen alles.
In vielen Anlagen tritt die erste Verzögerung auf, bevor die Instandhaltung überhaupt von einem Problem weiß. Je nach Schicht und diensthabender Person melden die Bediener einen Fehler entweder dem Linienführer, dem Produktionsleiter, der Leitwarte oder direkt einem Techniker. Diese Inkonsistenz führt zu vermeidbaren Verzögerungen, insbesondere wenn niemand für den nächsten Schritt verantwortlich ist. Wenn Sie versuchen, dies zu verbessern Reaktionszeit der Wartung, Dies ist oft der erste Arbeitsablauf, der untersucht werden sollte.
Ein typischer Engpass sieht folgendermaßen aus: Ein Bediener bemerkt ungewöhnliche Vibrationen an einer Abfüllanlage, meldet dies dem Schichtleiter. Dieser versucht, die Instandhaltung zu erreichen, doch niemand meldet sich sofort. Die Meldung wird dann über eine WhatsApp-Gruppe oder per Funk weitergeleitet, ohne dass die Zuständigkeit klar geregelt ist. Bis der zuständige Techniker die Anfrage erhält, können bereits 10 bis 20 Minuten vergangen sein, obwohl noch keine Reparaturarbeiten begonnen haben. Oft wird fälschlicherweise angenommen, es läge an der Verfügbarkeit von Technikern, dabei handelt es sich in Wirklichkeit um ein Problem mit der Meldung und Einsatzplanung.
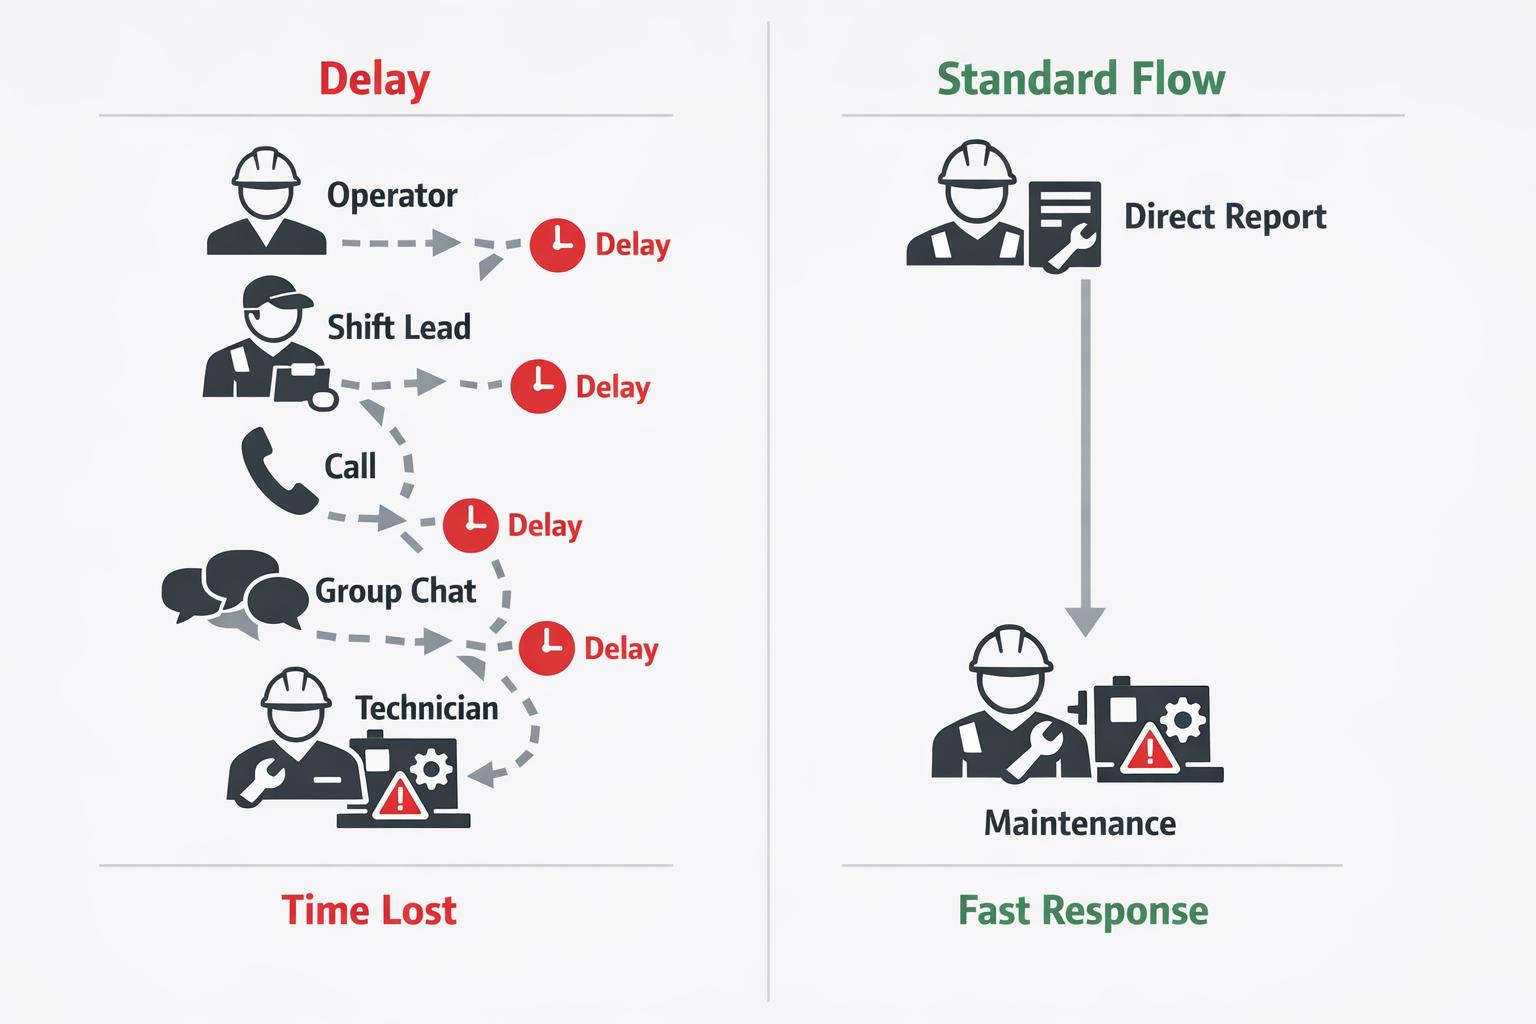
Unvollständige Informationen und manuelle Kommunikation führen zu sich gegenseitig verstärkenden Verzögerungen.
Selbst wenn eine Anfrage schnell die Wartung erreicht, mangelhafte Informationen Dies kann die tatsächliche Reaktion verzögern. Eine Meldung wie “Maschine angehalten” gibt dem Team nahezu keine Auskunft über die Anlage, Fehlersymptome, Sicherheitslage oder Auswirkungen auf die Produktion. Techniker verbringen dann zusätzliche Zeit mit Rückrufen, dem Gang zur Produktionslinie zur Überprüfung von Details oder dem Eintreffen ohne die richtigen Werkzeuge und Ersatzteile. In Umgebungen mit hoher Produktvielfalt oder mehreren Produktionslinien summiert sich dieser Zeitverlust über jede Schicht hinweg.
Viele Fabriken sind nach wie vor auf Telefonate, Funk und persönliche Netzwerke angewiesen, um die zuständige Person zu erreichen. Das funktioniert, solange erfahrene Vorgesetzte anwesend sind, ist aber während Pausen, Nachtschichten oder am Wochenende unzuverlässig. Ist eine Person nicht erreichbar, verzögert sich die Anfrage, bis entschieden wird, wen man als Nächstes kontaktiert. Diese unbemerkten Verzögerungen tauchen selten in den offiziellen Wartungsberichten auf.
Ein manueller Anrufbaum erschwert die Priorisierung zusätzlich. Eine Störung an einer unkritischen Verpackungsstation und ein Motorausfall an einer Engpass-Produktionslinie können ohne klare Prioritätslogik in dieselbe Warteschlange gelangen. Bei der späteren Überprüfung der Instandhaltungs-KPIs stellen Manager häufig fest, dass das Problem nicht in mangelnden Reparaturkenntnissen, sondern inkonsistenter Routenplanung und Priorisierung liegt.
Falsche Technikerzuweisung verschwendet das erste Reaktionsfenster
Eine Störungsmeldung, die an die falsche Person gesendet wird, kann mehr Zeit kosten als die eigentliche Reparatur. Elektrische Störungen werden an Mechaniker weitergeleitet, Probleme mit der Versorgungstechnik an die Produktionsinstandhaltung, oder es werden standortweite Techniker für Anlagen gerufen, die eigentlich vom Linienteam betreut werden sollten. Jede Umleitung verursacht zusätzliche Fahrtkosten, Rückrufe und Reibungsverluste bei der Übergabe. In größeren Werken kann das bedeuten, dass sich weitere 15 Minuten verzögern, bis der zuständige Techniker überhaupt vor Ort ist.
Genehmigungsverzögerungen und schwache Schichtübergaben verlängern die Reaktionszeit
Manche Reaktionsverzögerungen sind systembedingt. Ein Techniker weiß zwar, was zu tun ist, wartet aber dennoch auf die Produktionsfreigabe, um die Linie anzuhalten, auf die Freigabe eines Ersatzteils durch das Lager oder auf die Bestätigung der Priorität durch einen Vorgesetzten gegenüber anderen Aufträgen. In regulierten oder risikoreichen Umgebungen sind diese Kontrollen notwendig, doch viele Betriebe wenden sie zu weit gefasst auf routinemäßige Korrekturarbeiten an. Dadurch werden einfache Störungen zu langwierigen Koordinierungsübungen.
Der Effekt wird besonders deutlich, wenn die Reaktionszeit je nach Schicht stark variiert. Kann die Tagschicht innerhalb von fünf Minuten einsatzbereit sein, die Nachtschicht aber 18 Minuten, liegt die Ursache meist im Entscheidungsprozess und nicht in der Instandhaltungsfähigkeit. Deshalb sind die Zeitstempeldaten aus dem vorherigen Abschnitt so wichtig: Sie helfen zu erkennen, ob die Verzögerung bei der Meldung, der Zuweisung, der Genehmigung oder der Ausführung entsteht.
Langsame Reaktionszeiten stellen auch ein Problem bei der Schichtübergabe dar. Wird ein Problem kurz vor Schichtwechsel gemeldet, können offene Aufträge in Notizbüchern verschwinden, mündliche Mitteilungen hinterlassen oder unvollständig bearbeitet werden. CMMS Anmerkungen: Das neu hinzukommende Team weiß möglicherweise nicht, ob ein Techniker zugeteilt wurde, ob Ersatzteile unterwegs sind oder ob die Produktion auf eine Wiederaufnahmeentscheidung wartet. In der Praxis läuft die Zeit weiter, während alle Beteiligten die Situation rekonstruieren.
Dies ist einer der Gründe, warum sich die durchschnittlichen Reaktionszeiten in Betrieben manchmal verschlechtern, ohne dass die Personalstärke verändert wurde. Das Problem liegt nicht allein in der Personalstärke, sondern in der Kontinuität des Betriebsablaufs zwischen den Schichten. Bevor in weitere Techniker investiert wird, sollte man prüfen, ob der aktuelle Arbeitsablauf den Auftragsstatus klar und deutlich von einem Team zum nächsten überträgt.
Praktische Strategien zur Reduzierung der Reaktionszeit bei der Instandhaltung in der Fertigung
Ein praktischer Weg zur Verbesserung Reaktionszeit der Wartung ist, es als ein Prozessgestaltungsproblem, Es geht nicht nur um die Geschwindigkeit der Techniker. In den meisten Betrieben lassen sich die größten Verbesserungen erzielen, indem die Verzögerung zwischen Problemerkennung, eindeutiger Meldung, korrekter Zuweisung und Reparaturbeginn minimiert wird. Ein konkretes Beispiel: Eine Abfüllanlage an einer Verpackungslinie fällt während der Tagschicht aus, und der Betrieb möchte die Zeit von der Meldung des Bedieners bis zum Eintreffen des Technikers von 18 Minuten auf unter 8 Minuten verkürzen.
Standardisierung der Berichterstattung über Störungen
Legen Sie zunächst einen einheitlichen Meldeweg für jeden ungeplanten Anlagenstillstand fest. Wenn Bediener anrufen, eine SMS schreiben, einen Vorgesetzten kontaktieren oder die Instandhaltung persönlich informieren können, erhalten Sie immer wieder inkonsistente Zeitstempel und uneinheitliche Rückmeldungen. Ein standardisiertes Meldeformular sollte jedes Mal die gleichen Mindestdaten erfassen: Anlagen-ID, Leitung, Stillstandskategorie, Symptom, Schweregrad, Beobachtungszeitpunkt und gegebenenfalls Foto oder Video.
Im Beispiel der Verpackungslinie sollte der Bediener keine unstrukturierte Nachricht wie “Maschine ausgefallen, bitte kommen” eingeben. Ein strukturierter Bericht wie “Abfüllanlage 03, Förderbandstörung, komplette Linie gestoppt, Produktstau am Einlauf” liefert der Instandhaltung sofort genügend Kontext, um Prioritäten zu setzen und sich vorzubereiten. Allein dadurch lassen sich mehrere Minuten an unnötigen Rückfragen vermeiden.
Nutzen Sie anlagenspezifische QR-Codes, um Reibungsverluste bei der Berichterstattung zu vermeiden.
Sobald die Datenerfassungsmethode standardisiert ist, muss sie schnell genug sein, um unter realen Produktionsbedingungen eingesetzt werden zu können. (Veröffentlichung eines) QR-Code Die Eingabe bei jedem kritischen Anlagenteil ermöglicht es dem Bediener, das richtige Formular zu öffnen, in dem Maschinen-ID, Linie und Standort bereits eingetragen sind. Dies reduziert die Eingabezeit, vermeidet falsche Anlagenbenennungen und verbessert die Genauigkeit des ersten Datensatzes.
Dies ist besonders in großen Werken relevant, in denen ähnliche Maschinen über mehrere Produktionslinien oder Gebäude verteilt sind. Erhält ein Techniker beispielsweise einen Störungsbericht wegen eines “Dichtungsproblems”, obwohl das Werk sechs Dichtmaschinen besitzt, verlängert sich die Reaktionszeit, bevor die Reparaturarbeiten überhaupt beginnen können. Ein QR-Code-basierter Workflow beseitigt diese Unklarheit und liefert präzisere Daten für alle, die die Messmethoden überprüfen. Reaktionszeit der Wartung nach Etappen.
Benachrichtigungen nach Priorität weiterleiten und automatische Eskalationsregeln festlegen
Nach der Einnahme kommt der nächste Gewinn von Routing-Logik. Berichte sollten nicht in einem allgemeinen Posteingang landen, wo erst jemand entscheiden muss, wer dafür zuständig ist. Sie sollten direkt an den zuständigen Techniker oder die zuständige Wartungsgruppe weitergeleitet werden, basierend auf Produktionslinie, Anlagenklasse, Schicht und Dringlichkeit.
Beispielsweise sollte eine kleinere Störung an einer sekundären Verpackungsstation nicht denselben Ablauf auslösen wie ein vollständiger Ausfall der Abfüllanlage, der den vorgelagerten Produktionsfluss unterbricht. Kritische Stillstände können den Anlagenmechaniker sofort alarmieren, den Schichtleiter benachrichtigen und gleichzeitig einen SLA-Timer starten. Probleme mit geringerer Priorität können in die geplante Warteschlange aufgenommen werden, ohne Notfallmaßnahmen zu unterbrechen.
An diesem Punkt beginnen viele Betriebe, von Prozessoptimierungen zu umfassenderen Systemänderungen überzugehen. Automatisierte Routing- und Eskalationslogik kann die Reaktionszeit der Instandhaltung um mehrere Minuten verkürzen, da die Zuweisung sofort erfolgt und nicht erst, nachdem ein Vorgesetzter eine Meldung erhalten hat. Im Verpackungsbeispiel sollte eine Meldung “Linie gestoppt” von Abfüllanlage 03 an den diensthabenden Instandhaltungstechniker der Getränkelinie weitergeleitet werden, mit einer alternativen Zuweisung, falls innerhalb von zwei Minuten keine Bestätigung erfolgt.
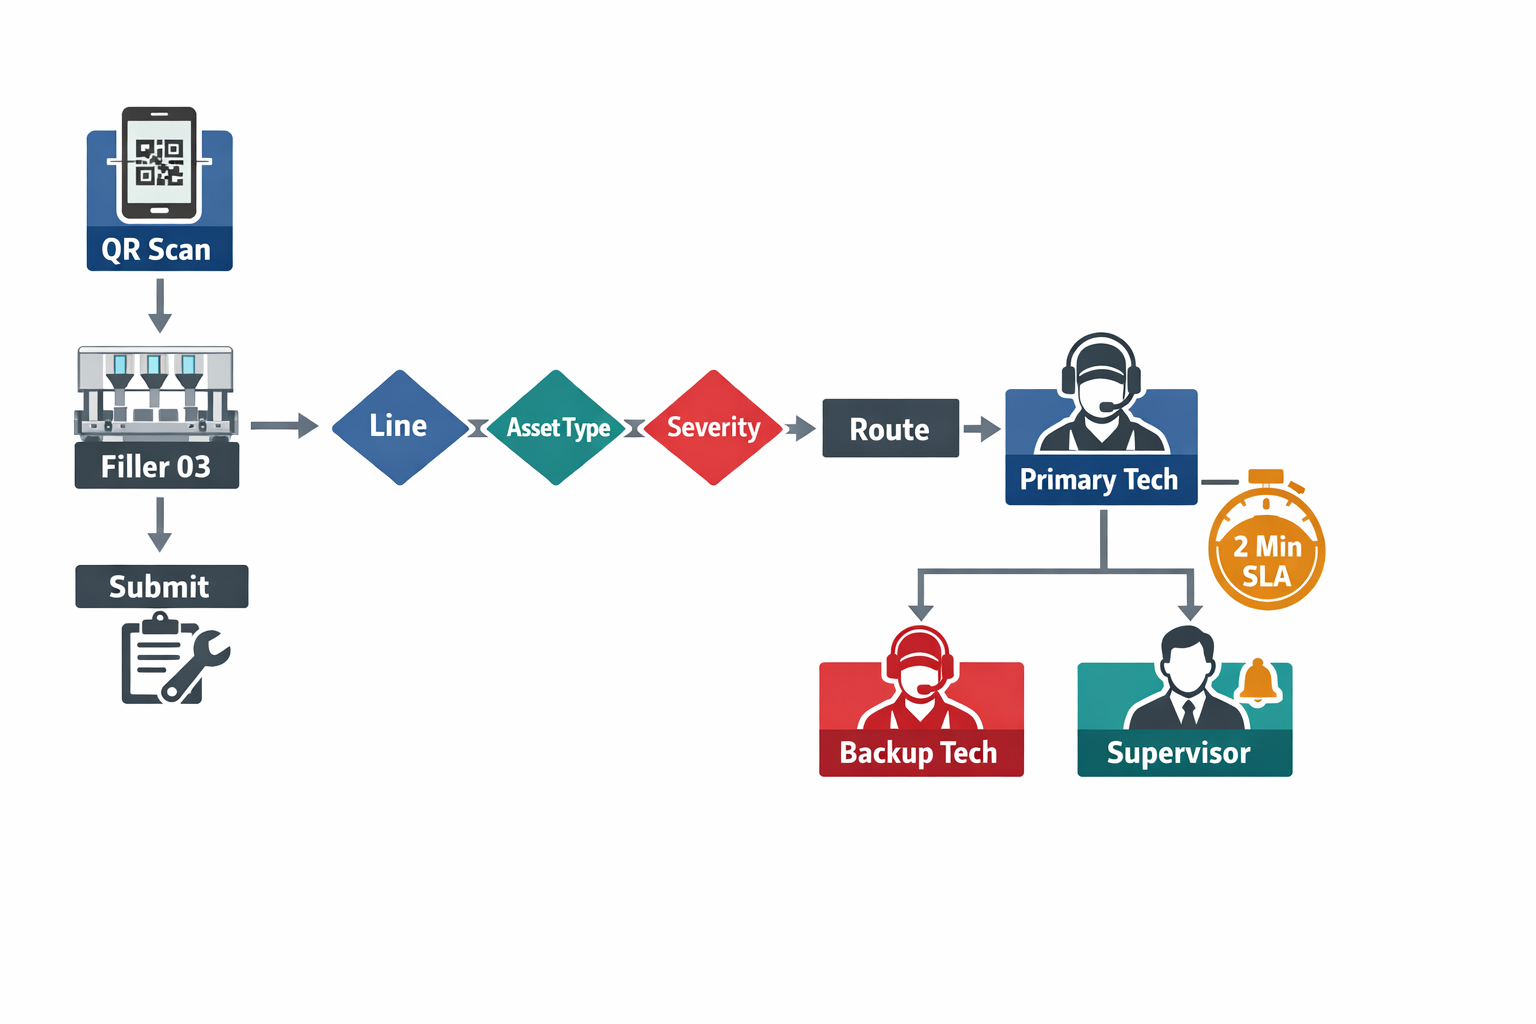
Die Eskalation sollte auf der verstrichenen Zeit basieren, nicht auf Erinnerung oder persönlicher Einschätzung. Wenn innerhalb eines festgelegten Zeitraums niemand einen kritischen Ausfall bestätigt, sollte die Anfrage automatisch an die nächste Ebene weitergeleitet werden: einen anderen Techniker, den Instandhaltungsleiter oder beide. Ohne diese Regel bemerken Betriebe die Verzögerung oft erst, wenn die Produktion bereits aktiv nach Aktualisierungen sucht.
Gute Eskalationsregeln sind einfach und messbar. Beispielsweise könnte man eine zweiminütige Bestätigungsfrist für Anlagenstillstände, eine fünfminütige Ankunftszeit für Anlagen mit höchster Priorität und eine automatische Eskalation an den Vorgesetzten festlegen, falls eine dieser Fristen nicht eingehalten wird. Diese Schwellenwerte sollten die tatsächliche Anlagenstruktur, das Personalmodell und die Schichtabdeckung widerspiegeln und nicht auf vorgegebenen Benchmarks basieren.
Im Fall der Verpackungslinie sollte das System, falls der zuständige Techniker bereits mit einem anderen dringenden Auftrag beschäftigt ist, nicht auf eine manuelle Übergabe warten. Es sollte den Ersatztechniker alarmieren und die Anfrage für den Schichtleiter deutlich kennzeichnen. Dadurch wird die Reaktionszeit auch bei Personalengpässen sichergestellt.
Verbesserung der Transparenz während der Schicht für Instandhaltung und Produktion
Eine schnellere Reaktion hängt ab von gemeinsame Sichtbarkeit, Insbesondere schicht- und abteilungsübergreifend. Die Instandhaltung benötigt eine Übersicht aller offenen Prioritäten in einer zentralen Warteschlange, während die Produktion einen klaren Status benötigt, ohne wiederholt nachfragen zu müssen. Eine übersichtliche Arbeitswarteschlange mit Statusänderungen wie gemeldet, bestätigt, unterwegs, angekommen und Reparatur begonnen sorgt dafür, dass alle Beteiligten stets über den aktuellen Stand informiert sind.
Hier kommt Ihre Messdisziplin auch der Umsetzung zugute. Wenn Sie bereits wissen, wie man misst. Reaktionszeit der Wartung Bei jeder Übergabe können Sie diese Phasen im täglichen Arbeitsablauf sichtbar machen, anstatt sie nur in Monatsberichten darzustellen. Werke, die dies gut umsetzen, können erkennen, ob Verzögerungen durch fehlende Bestätigung, Reisen von Technikern oder Wartezeiten auf Genehmigungen verursacht werden.
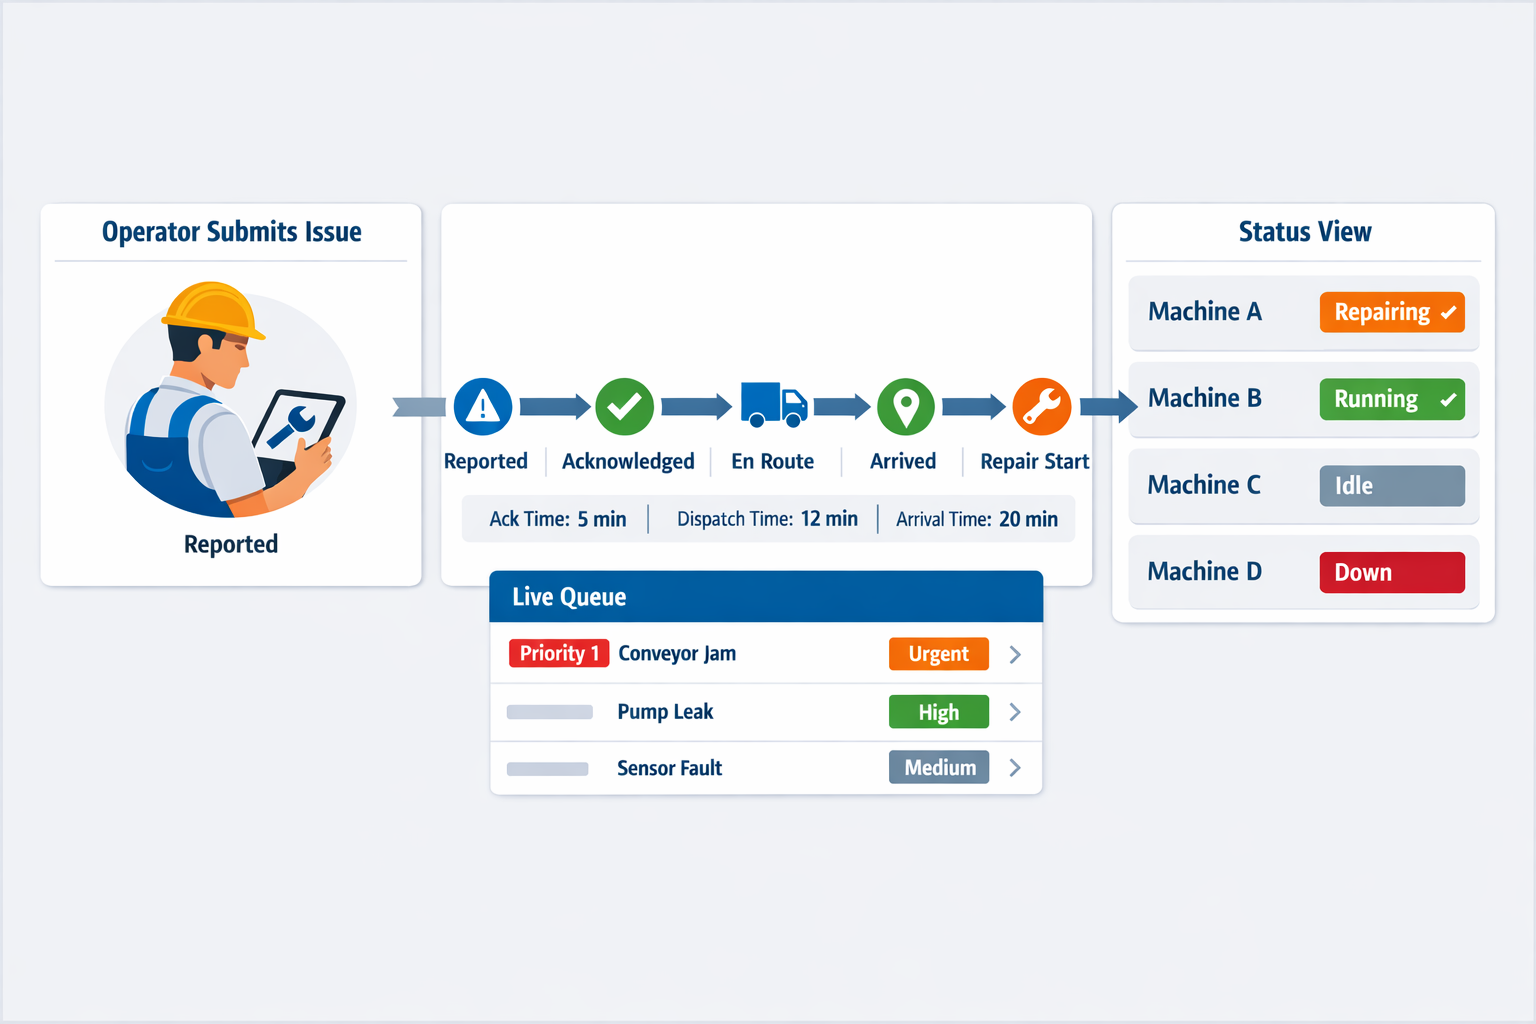
Genehmigungsschritte digitalisieren, die den Reparaturbeginn verzögern
Nicht jeder Auftrag bedarf einer Genehmigung, doch wenn Genehmigungen erforderlich sind, dürfen diese eine dringende Reaktion nicht durch Papierformulare, Anrufe oder unklare Zuständigkeiten behindern. Häufige Verzögerungen entstehen durch das Warten auf die Freigabe durch den Vorgesetzten für die Beauftragung von Fremdfirmen, die Freigabe von Ersatzteilen, die Genehmigung von Absperrungen oder die Genehmigung von Überstunden. Bleiben diese Entscheidungen manuell, kann die Reaktionszeit selbst bei gut organisierter Meldung und Einsatzplanung langsam bleiben.
Die praktische Lösung besteht darin, festzulegen, welche Entscheidungen vorab genehmigt werden können und welche einen schnellen digitalen Genehmigungsprozess erfordern. Beispielsweise können bei Anlagenstillständen an kritischen Anlagen sofortige Maßnahmen und die Ausgabe von Standardersatzteilen bis zu einem bestimmten Wert ermöglicht werden, während die Eskalation durch einen externen Dienstleister weiterhin die Genehmigung des Vorgesetzten erfordert. Dadurch werden echte Kontrollpunkte von unnötigen Reibungsverlusten getrennt.
Einige Verbesserungen lassen sich noch in diesem Monat umsetzen, andere erfordern eine funktionsübergreifende Planung. Zu den schnell umsetzbaren Maßnahmen gehören die Vereinfachung des Fehlerberichts, die Standardisierung der Schweregradcodes, das Anbringen von QR-Codes an kritischen Anlagen und die Definition von Bestätigungs- und Eskalationszielen. Diese Maßnahmen führen in der Regel zu Verbesserungen. Reaktionszeit der Wartung ohne größere Investitionen.
Zu den größeren Änderungen gehören die Erstellung rollenbasierter Routenplanung, die Vernetzung von Wartungsabläufen über verschiedene Schichten hinweg und die Verknüpfung von Reaktionsdaten mit Dashboards zur Analyse von Linien, Anlagen und Technikern. Diese Änderungen sind wichtig, da sie aus einzelnen Fehlerbehebungen ein wiederholbares Betriebsmodell machen. Sie erleichtern außerdem den Vergleich von Werken, Schichten und Anlagengruppen anhand der Wartungs-KPIs, die jeder Manager im Blick behalten sollte.
Wie man das geeignete System auswählt, das die Reaktionszeit bei der Wartung verbessern kann
Auswahl eines Systems zur Verbesserung Reaktionszeit der Wartung Es geht weniger darum, mehr Funktionen zu kaufen, sondern vielmehr darum, Verzögerungen zwischen Signal, Entscheidung und Aktion zu beseitigen. Die richtige Konfiguration sollte Ihnen helfen, präzise Ausfalldaten schnell zu erfassen, sie umgehend an die zuständige Person weiterzuleiten und jeden Schritt für die Nachverfolgung transparent zu machen. Wenn Sie bereits wissen, wie Sie die Reaktionszeit im Wartungsbereich messen, geht es in diesem Abschnitt um die Auswahl der operativen Tools, die diese Werte tatsächlich verbessern können.
Mobile Berichterstattung und schnelle, strukturierte Datenerfassung
Ein effizientes Reaktionssystem sollte es den Bedienern ermöglichen, Probleme direkt an der Produktionslinie innerhalb von Sekunden zu melden – nicht erst, nachdem sie einen Vorgesetzten kontaktiert oder zu einem Terminal zurückgekehrt sind. Mobile Formulare, Tablets an der Maschine oder QR-Code-basierte Meldungen reduzieren Verzögerungen bereits im ersten Schritt. Noch wichtiger ist, dass der Bericht strukturierte Felder wie Anlagen-ID, Produktionslinie, Fehlertyp, Priorität und Fotobeweise enthalten sollte, damit die Techniker keine Zeit mit der Klärung grundlegender Informationen verlieren.
Intelligentes Routing, sofortige Benachrichtigungen und konfigurierbare Arbeitsabläufe
Sobald eine Anfrage gestellt wird, sollte das System die zuständigen Personen umgehend über die von ihnen genutzten Kanäle benachrichtigen – sei es per App-Benachrichtigung, E-Mail, SMS oder Anzeige im Produktionsbereich. Wichtiger noch: Benachrichtigungen sollten anhand praktischer Regeln wie Produktionslinie, Anlagengruppe, Fehlerkategorie, Schweregrad, Schicht oder Qualifikation des Technikers weitergeleitet werden. Ein System, das jede Benachrichtigung an alle sendet, erzeugt in der Regel nur unnötige Störungen, anstatt die Bearbeitung zu beschleunigen.
Die manuelle Berichterstattung ist darauf angewiesen, dass sich die Mitarbeiter merken, wen sie anrufen müssen, genügend Details notieren und Aktualisierungen schichtübergreifend korrekt weitergeben. Herkömmliche, fest installierte Software verbessert zwar die Dokumentation, zwingt aber oft alle Werke dazu, dieselben Arbeitsabläufe, Genehmigungslogiken und Auftragsstrukturen zu befolgen – unabhängig davon, ob diese optimal passen oder nicht. Konfigurierbare digitale Workflow-Systeme sind leistungsfähiger, da sie es ermöglichen, den Prozess an die tatsächlichen Produktionslinien, Schichtmuster, Anlagenkritikalität und Eskalationsregeln Ihres Werks anzupassen.
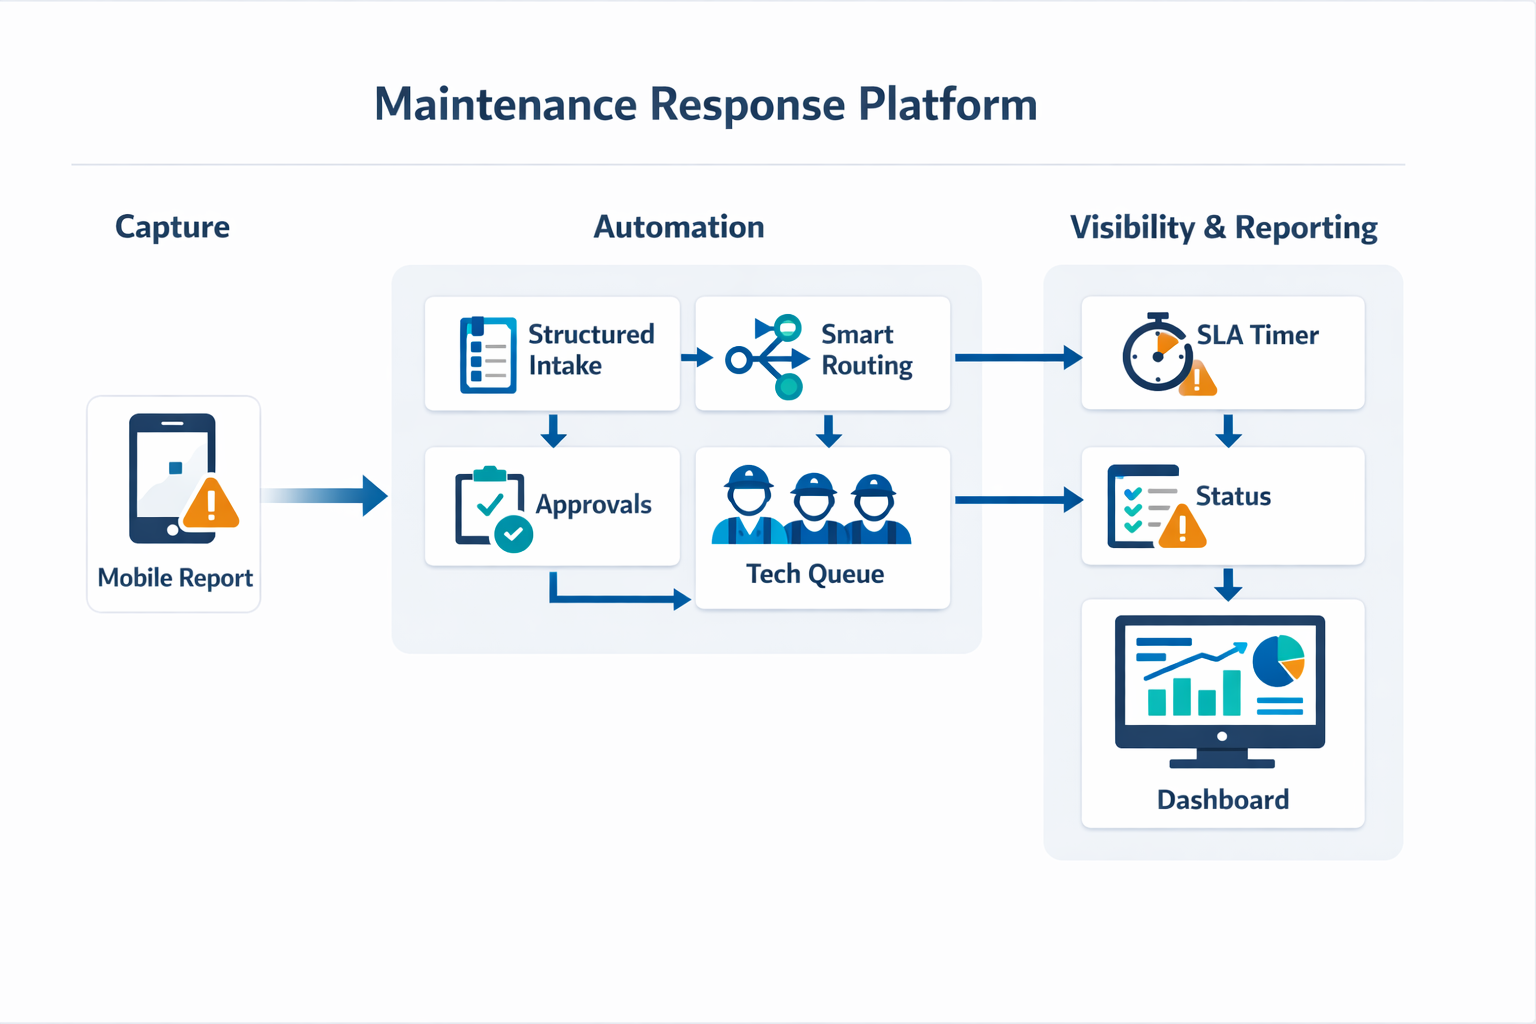
Diese Flexibilität ist besonders in Betrieben mit gemischten Produktionsabläufen wichtig. Eine Lebensmittelfabrik benötigt beispielsweise bei Abfüllanlagenstillständen sofortige Meldungen, bei nicht dringenden Problemen die Genehmigung des Vorgesetzten und in der Nachtschicht, wenn weniger Fachkräfte vor Ort sind, andere Eskalationsregeln. Kann sich das System diesen Gegebenheiten nicht anpassen, greift man wieder auf informelle Telefonate, Messenger-Dienste und manuelle Behelfslösungen zurück.
SLA-Timer, Warteschlangen und Statusübersicht
Um die Reaktionszeit kontinuierlich zu verbessern, benötigt das System integrierte Zeiterfassung und Verantwortlichkeitsmechanismen. Das bedeutet automatische Zeitstempel für Einreichung, Bestätigung, Zuweisung, Eingang und Arbeitsbeginn sowie SLA-Timer, die signalisieren, wenn eine Anfrage in einer beliebigen Phase zu lange verweilt. Diese Zeitstempel unterstützen sowohl die tägliche Kontrolle als auch langfristige Überprüfungen der Messmethoden. Reaktionszeit der Wartung präzise über alle Teams und Schichten hinweg.
Die Arbeitslisten der Techniker sind ebenso wichtig. Jeder Techniker oder Vorgesetzte sollte offene Aufträge nach Priorität, Fälligkeit, Ort und Status einsehen können, ohne auf mündliche Informationen angewiesen zu sein. Eine transparente Liste reduziert die Auswahl einzelner Aufträge, vermeidet doppelte Antworten und hilft Vorgesetzten, die Arbeitsbelastung neu zu verteilen, wenn sich in einem Bereich dringende Anrufe häufen.
Dashboards, die aufzeigen, wo Zeit verloren geht
Dashboards sollten mehr leisten als nur die Anzahl abgeschlossener Arbeitsaufträge anzuzeigen. Sie sollten die Leistung auf Phasenebene darstellen, wie z. B. die durchschnittliche Bestätigungszeit, die durchschnittliche Einsatzbereitschaftszeit, die Reaktionszeit pro Linie, den Rückstand pro Schicht und wiederholte Verstöße pro Anlage oder Team. Dies sind die Instandhaltungs-KPIs, die Manager verfolgen sollten, wenn sie den Arbeitsablauf verbessern und nicht nur Aktivitäten dokumentieren wollen.
Die besten Dashboards unterstützen auch Drilldown-Funktionen. Wenn Zeile 3 eine längere durchschnittliche Reaktionszeit als Zeile 1 aufweist, sollten Sie erkennen können, ob die Verzögerung auf Meldungen, Aufgabenverteilung, Reisen oder Genehmigungswarteschlangen zurückzuführen ist. So werden Rohdaten in operative Maßnahmen umgewandelt, anstatt nur ein weiterer Monatsbericht zu sein.
Flexibilität über Schichten, Linien und Standorte hinweg
Schließlich sollte das System skalierbar sein und sich an die tatsächlichen Betriebsabläufe Ihres Werks anpassen. Ein einzelnes Werk mit einer einzigen Instandhaltungsabteilung benötigt andere Anforderungen als ein Konzern mit mehreren Gebäuden, Schichtbetrieb und gemeinsam genutzten Technikern für Versorgung, Verpackung und Produktion. Rollenbasierte Berechtigungen, schichtspezifische Routenplanung, standortbezogene Dashboards und konfigurierbare Warteschlangen werden mit zunehmender Komplexität unerlässlich.
Hier kommen auch konfigurierbare Plattformen wie zum Einsatz. Jodoo relevant werden. Anstatt Wartungsteams in eine starre Vorlage zu zwingen, ermöglicht Jodoo Ihnen, mobile Berichtsformulare, Routing-Regeln, Genehmigungsprozesse, Technikerwarteschlangen und Dashboards auf Basis Ihrer eigenen Anlagen, Schichtlogik und Reaktionsziele zu erstellen.
Fazit: Wie Jodoo Hilft Herstellern, die Reaktionszeit bei Wartungsarbeiten zu verkürzen und Ausfallzeiten zu minimieren.
Reaktionszeit der Wartung ist nicht nur eine Kennzahl für die Instandhaltung. Sie misst direkt, wie schnell Ihr Werk Ausfallzeiten minimieren, den Durchsatz sichern und Produktionszusagen einhalten kann. Bei langsamer Reaktion beschränken sich die Verluste selten nur auf die Reparaturzeit. Sie äußern sich auch in Leerlaufzeiten für Mitarbeiter, blockierten Produktionslinien, verpassten Terminen und vermeidbaren Spannungen zwischen Produktion und Instandhaltung.
Deshalb ergeben sich die größten Verbesserungen oft aus der Optimierung des Arbeitsablaufs rund um eine Störung, und nicht nur aus der Reparatur selbst. Jodoo Unterstützt Hersteller bei der Digitalisierung ihrer Arbeitsabläufe durch mobile Störungsmeldungen, anlagenspezifische Formulare, automatische Techniker-Routing-Funktion nach Leitung oder Fehlertyp, Echtzeit-Statusverfolgung und Dashboards, die die genaue Dauer jedes einzelnen Schrittes von der Meldung bis zur Behebung anzeigen. Anstatt auf physische Andon-Kabel, Anrufe und Papierprotokolle angewiesen zu sein, können Sie einen schnellen, transparenten und schichtübergreifend einheitlichen Reaktionsprozess aufbauen.
Wenn Sie Ausfallzeiten durch eine Beschleunigung der Wartungsabläufe reduzieren möchten, sollten Sie Jodoo als No-Code-Plattform für schlanke Fertigung in Betracht ziehen. Sie können Kostenlose Testversion starten oder Demo buchen um zu sehen, wie es zu Ihrer Pflanze passt.