Browse by category

Introduction: Why Failure Mode and Effects Analysis Matters on the Factory Floor
A single missed failure mode can trigger scrap, line stoppages, customer complaints, or even a recall. In automotive manufacturing, the average cost of a recall can reach millions of dollars, while in electronics, one unstable soldering step can quietly create field failures that are far more expensive than in-process defects. That is why Failure Mode and Effects Analysis (FMEA) remains one of the most practical risk-prevention tools available to quality and process engineers.
On the factory floor, FMEA helps teams ask the right questions before problems scale: What can fail, how will it affect the customer or the next process, what is causing it, and how likely are current controls to catch it? For example, a machining line may identify tool wear as a source of dimensional drift, while an SMT line may flag insufficient reflow control as a cause of solder joint defects. In both cases, the goal is the same: prevent avoidable failures before they reach production, shipment, or the customer.
This guide will walk you through how to conduct an FMEA step by step, how Severity, Occurrence, and Detection ratings are used to prioritize risk, and how manufacturers can move from static spreadsheets to a more controlled digital workflow.
What FMEA Covers
What an FMEA Actually Documents
FMEA is a structured way to document how a product or process can fail, what happens if it does, why it happens, and what controls already exist. In manufacturing terms, it turns shop-floor knowledge into a visible risk register before defects reach the next operation or the customer. For quality and process engineers, that makes it more than a compliance document; it becomes the foundation for deciding where investigation and prevention effort should go.
A failure mode is the specific way something goes wrong, such as insufficient solder on a PCB joint, a cracked molded housing, or a label applied to the wrong SKU. The effect is the result of that failure, which could be intermittent electrical contact, water ingress, or customer misidentification in the field. The cause is the underlying reason the failure happens, such as nozzle clogging, poor mold cooling balance, or an unvalidated label template. The control is the current method used to prevent the issue or detect it before escape, including poka-yoke devices, first-piece inspection, AOI, torque checks, or operator verification steps.
Design FMEA vs Process FMEA
Manufacturing teams often need to decide between design FMEA vs process FMEA, and the difference is straightforward. Design FMEA (DFMEA) evaluates risks built into the product design itself, before production methods are even considered. For example, if an electronics enclosure housing has a thin snap-fit that may crack during assembly or use, that is a design risk because the geometry and material choice create the weakness.
Process FMEA (PFMEA) focuses on how the manufacturing or assembly process could create defects even if the design is sound. A PCB assembly line may have a well-designed board, but solder bridging can still occur because of stencil wear, incorrect paste volume, or reflow profile drift.
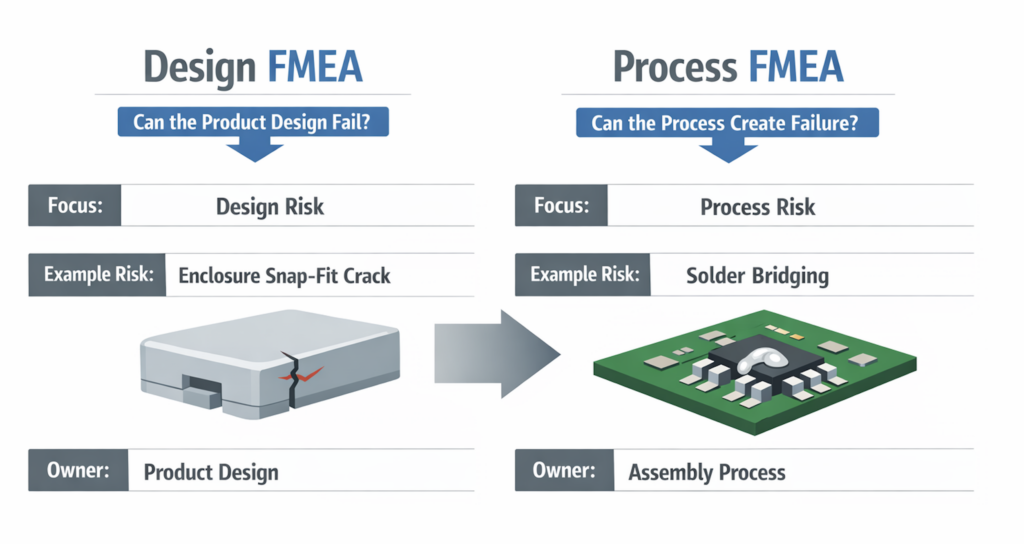
This distinction matters because the action owner changes with the risk. A DFMEA issue usually sits with design engineering, product development, or supplier engineering, while a PFMEA issue typically belongs to manufacturing engineering, quality, maintenance, or production. Teams that mix the two often create vague action plans, which is one reason a clear FMEA scope matters before you get into how to conduct an FMEA step by step.
When Teams Should Use FMEA
The best time to use FMEA is before launch, when design and process decisions are still easy to change. Automotive and electronics suppliers commonly build FMEAs during APQP because late-stage defects are far more expensive to correct; industry studies often cite that the cost of fixing a defect after release can be several times higher than correcting it during development. Even outside formal launch programs, the method is useful whenever a process is new, unstable, or customer-critical.
Teams should also update an FMEA during process changes, such as line relocation, tooling replacement, material substitution, cycle-time reduction, or automation upgrades. These changes often alter failure mechanisms in ways that are not obvious from yield data alone. An FMEA helps engineers capture new causes and controls before the first complaint or audit finding appears.
Recurring defects, near misses, warranty returns, and rising audit exposure are also valid triggers. If a plant keeps seeing the same burr issue, leak failure, or missing-component defect, the FMEA gives the team a disciplined place to reassess causes, controls, and priorities. The scoring logic, including calculating the risk priority number in FMEA, comes next.
How to Conduct an FMEA Step by Step
Define the Scope and Map the Process
To show how to conduct an FMEA step by step, use one clear process boundary from the start. In this example, the team is reviewing a PCB assembly line for a controller board, with scope limited to solder paste printing, component placement, reflow soldering, and final visual inspection. That keeps the analysis practical and avoids mixing upstream design issues with process risks, which is important when deciding between design FMEA vs process FMEA in real projects.
Start by mapping the process exactly as it runs on the shop floor, not as the SOP says it should run. A simple flow with four to six major steps is enough for the first pass, as long as each step can be linked to a potential failure mode. The goal is to create the backbone of the worksheet before the team starts debating ratings or actions.
Build the Right Cross-Functional Team
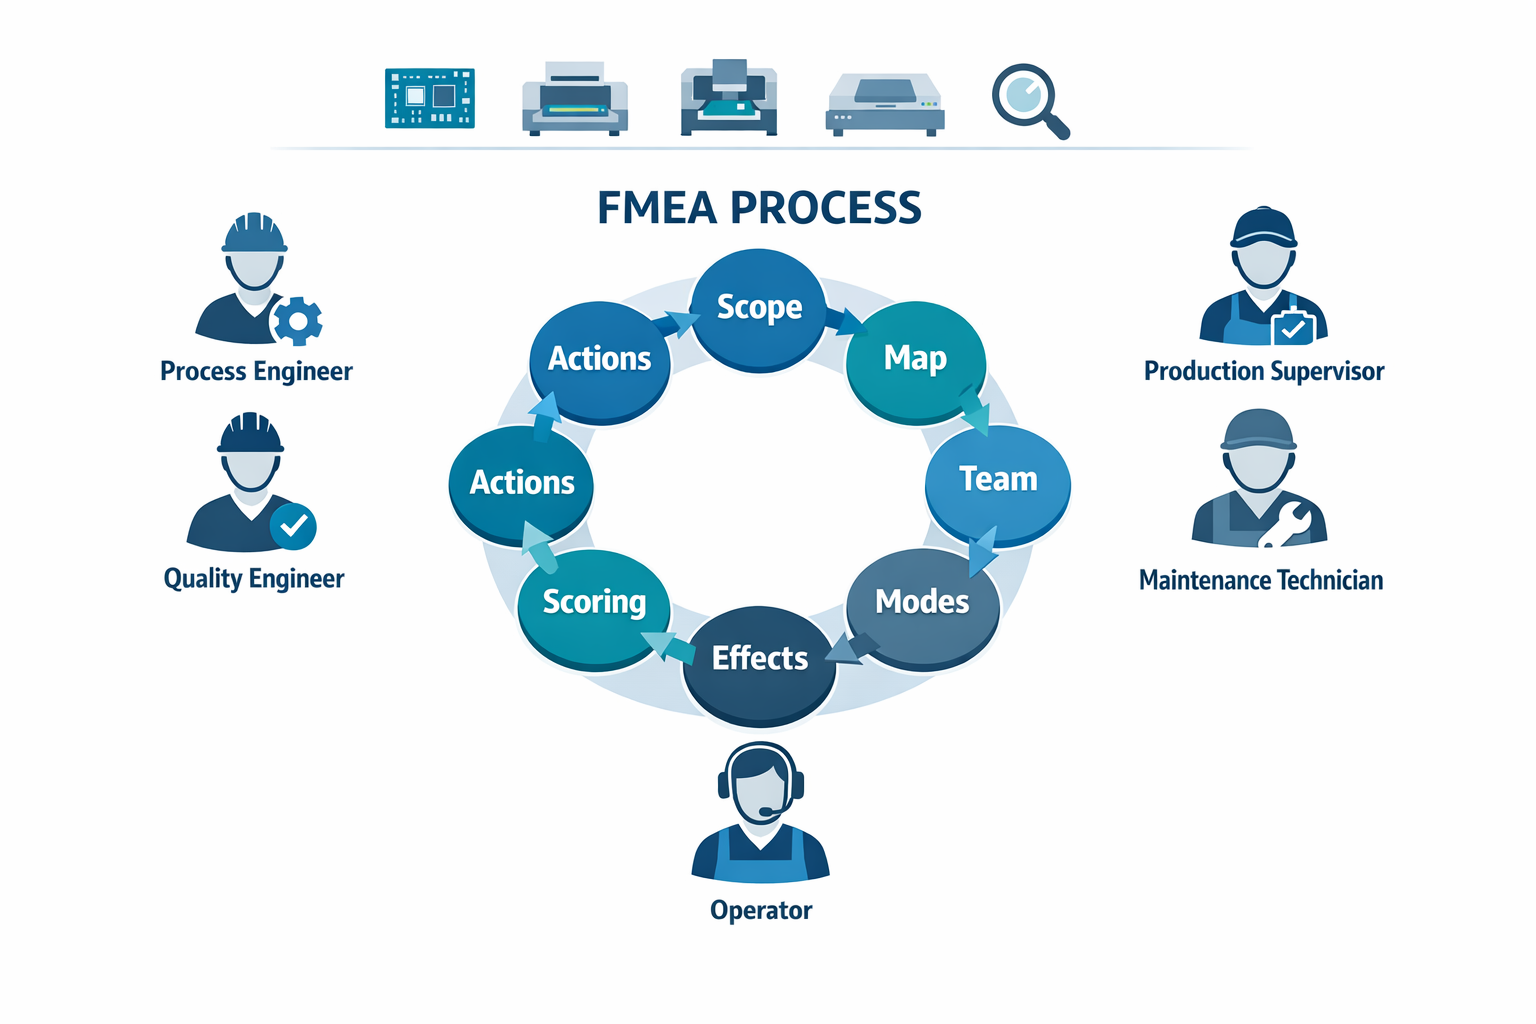
An effective FMEA is rarely written well by one engineer alone. For the PCB line, the core team should include a process engineer, quality engineer, production supervisor, maintenance technician, and operator or line leader who sees daily variation firsthand. If suppliers or test engineers influence the process, bring them in for the relevant steps rather than for the full session.
The step-by-step FMEA workflow is straightforward: define scope, map the process, form the team, identify failure modes, record effects and causes, document current controls, score the risk, assign actions, and review results. What makes it work is not the template itself but the discipline of moving row by row through the process while keeping the discussion tied to evidence. That turns tribal knowledge into a structured risk register the team can actually use.
Identify Failure Modes, Effects, and Causes
With the team aligned, review each process step and ask what could go wrong at that step. At solder paste printing, one failure mode might be insufficient solder paste on fine-pitch pads. At reflow, another could be cold solder joints caused by an unstable thermal profile.
Next, capture the effect of each failure mode in operational terms. Insufficient paste may cause intermittent electrical contact, in-circuit test failure, or field reliability issues after shipment. Then list the likely causes, such as stencil wear, poor paste viscosity control, printer misalignment, or incorrect squeegee pressure.
Document Current Controls and Score the Risk
After causes are listed, document the controls already in place for prevention and detection. In the PCB example, prevention controls may include stencil-cleaning frequency, machine setup verification, and paste-temperature checks, while detection controls may include SPI, AOI, and first-piece inspection. Be specific, because vague controls like “operator checks” make later prioritization weak.
Once the row is complete, the team assigns Severity, Occurrence, and Detection ratings based on the agreed company scale. This is where the risk priority number in FMEA is calculated, but the scoring logic will be covered in the next section. Here, the main task is to score consistently enough to compare risks across process steps.
Prioritize Actions and Review the Results
After scoring, sort the highest-risk items and decide what action will reduce the risk fastest and most reliably. For insufficient solder paste, the action may be to tighten stencil replacement limits, add automatic paste height alarms, and revise setup verification for new product changeovers. Each action should have an owner, due date, and expected impact on occurrence or detection.
The review should end with a clean, updated register rather than a list of discussion points. Re-score completed actions, confirm whether risk has dropped to an acceptable level, and reopen items if process performance does not improve. That is how an FMEA moves from a workshop exercise into a controlled improvement process.
Scoring Severity, Occurrence, and Detection to Prioritize Risk
After you identify failure modes, causes, and current controls, the next step in FMEA is scoring risk in a consistent way. This is where many teams lose discipline, especially when ratings are based on habit instead of shared criteria. In the PCB assembly example from the previous section, assume the team is reviewing a solder-bridge failure mode at the reflow stage that can create a short circuit on the finished board. The goal is not to find a “perfect” number, but to score the risk logically enough that priorities are clear.
Severity: Rate the Impact if the Failure Reaches the Next Stage
Severity measures the consequence of the failure effect, not how often it happens and not how easy it is to detect. In this PCB case, a solder bridge can cause electrical failure, functional test rejection, or worse, a field failure if it escapes. If the defect could shut down the product, trigger a customer complaint, or create a safety-related malfunction, the Severity rating should be high. Teams should anchor ratings to business and customer impact, using agreed criteria so one engineer’s “7” does not become another engineer’s “9.”
Occurrence: Rate How Likely the Cause Is to Happen
Occurrence reflects how often the cause of the failure mode is expected to occur under current process conditions. For the solder-bridge example, the cause might be excessive solder paste volume, stencil wear, or poor component spacing combined with reflow variation. If SPI and defect history show that paste-related bridging appears in 2 out of every 1,000 boards, the team should score Occurrence based on that actual frequency rather than opinion. This is why teams learning how to conduct an FMEA step by step should bring scrap data, first-pass yield trends, and line-level defect records into the scoring discussion.
Detection: Rate How Likely Current Controls Are to Catch It
Detection measures the ability of existing controls to find the failure before it moves downstream or reaches the customer. It does not rate the quality of the team’s response after detection. In the same process FMEA example, the current controls may include solder paste inspection, AOI after reflow, and final functional testing. If AOI reliably flags most bridges before the board advances, Detection is relatively strong; if defects are only found later during end-of-line test, the Detection rating should be worse because the process allows more escapes and more rework cost.
How the Three Ratings Combine Into RPN
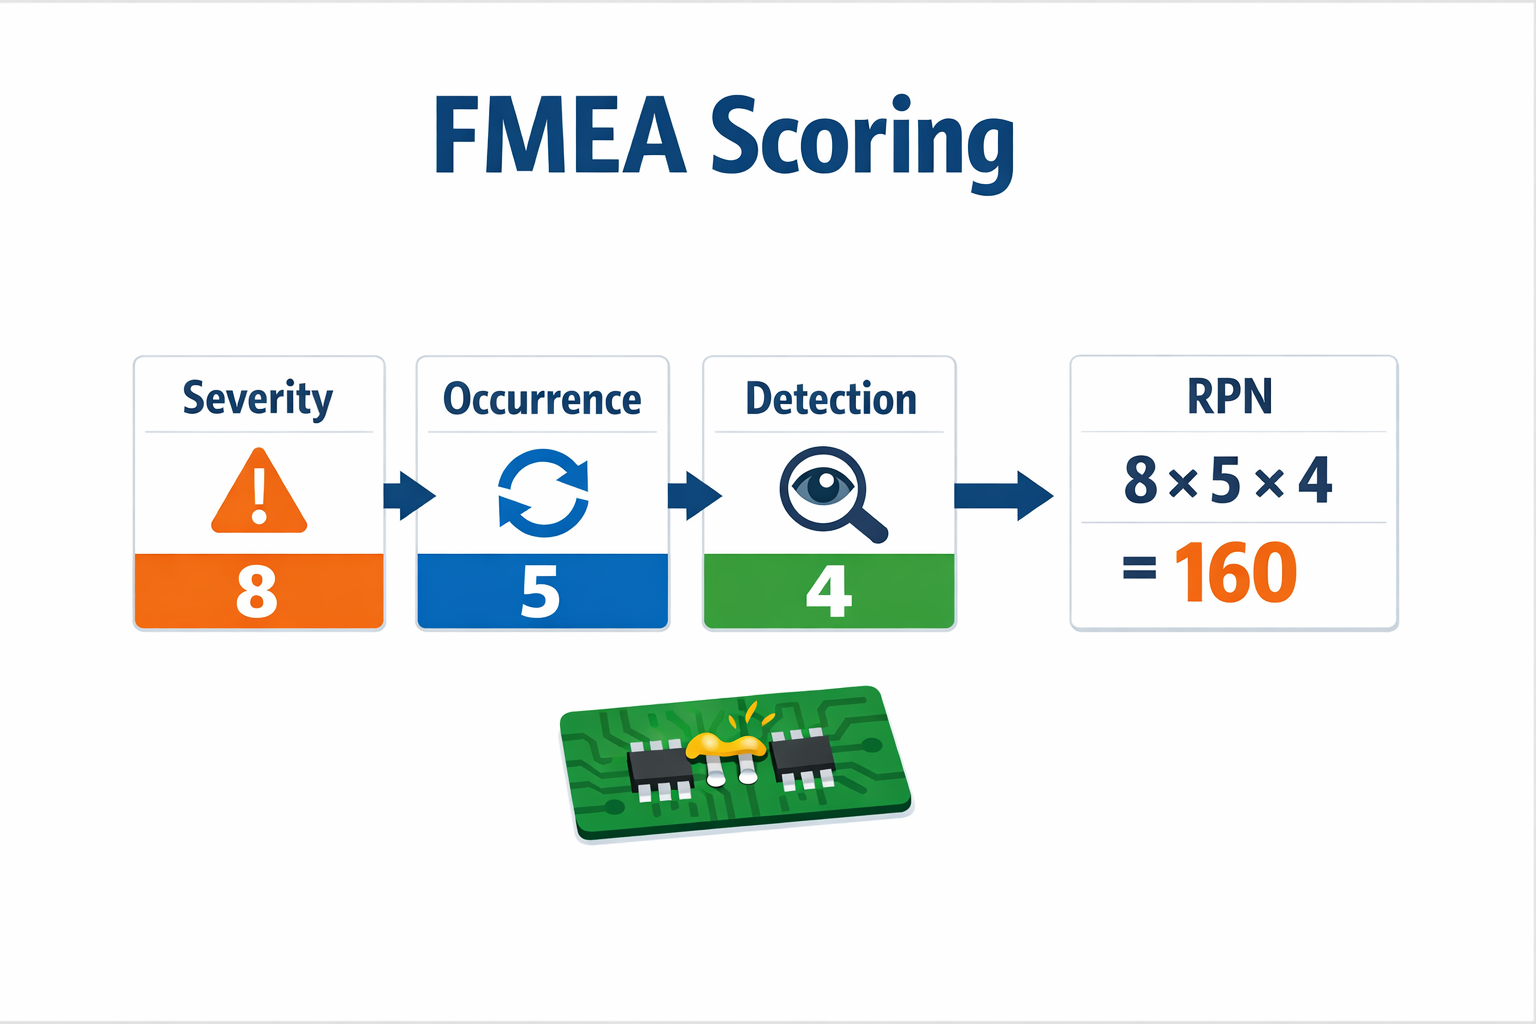
When teams move through an FMEA step by step, these three ratings are combined to prioritize action. The standard formula for calculating the risk priority number in FMEA is:
RPN = Severity × Occurrence × Detection
Using the PCB example, a solder bridge scored at Severity 8, Occurrence 5, and Detection 4 produces an RPN of 160. That number does not replace engineering judgment, but it gives the team a structured way to compare this risk against other failure modes on the same line.
Use Ratings to Drive Consistent Decisions
The practical value of scoring is comparison, not mathematics for its own sake. A failure mode with moderate Severity but frequent occurrence may deserve faster action than a severe but highly controlled issue, depending on your thresholds. That is one reason design FMEA vs process FMEA scoring discussions can differ: DFMEA often emphasizes end-use impact, while PFMEA focuses more heavily on manufacturing variation and control effectiveness. In either case, the discipline is the same—use defined criteria, support ratings with evidence, and review scores whenever process changes alter the real risk.
From Spreadsheet FMEA to a Digital Workflow
Why Spreadsheet FMEAs Lose Control
By this stage in the PCB assembly PFMEA, the team has identified a high-risk failure mode: insufficient solder paste on fine-pitch pads, leading to weak joints and intermittent field failure. The analysis is sound, but many teams still manage the next steps in spreadsheets, email threads, and meeting notes. That is where Failure Mode and Effects Analysis often starts to lose value. The problem is not the method itself, but the lack of process control around it.
In practice, spreadsheet-based FMEAs break down in predictable ways. One engineer updates Occurrence after a stencil change, while quality still reviews an older file with the previous score. Severity and Detection ratings drift because different people interpret scales differently, and there is no built-in logic to enforce scoring rules. Actions get listed, but ownership, due dates, and evidence of completion often sit outside the FMEA, weakening the link between risk analysis and actual process improvement.
Building a Digital PFMEA Record
A digital PFMEA workflow solves this by turning the worksheet into a controlled operating process. Instead of storing rows in disconnected files, you can structure each failure mode as a live record with standard fields for process step, failure mode, effect, cause, current controls, Severity, Occurrence, Detection, and action status. That keeps the team aligned on the current version and makes audit review much easier. It also supports the same disciplined logic used when learning how to conduct an FMEA step by step, but with tighter execution after scoring.
With Jodoo, quality or process engineering can build that PFMEA structure as a no-code form and database without waiting for IT development. The form can standardize rating scales, require mandatory fields before submission, and preserve revision history for every update. That matters when a customer asks why a score changed after a line trial or process change. It also helps separate process FMEA control from design FMEA activities, which is important when teams manage design FMEA vs process FMEA in different review cycles.
Automating RPN Calculation and Action Triggers
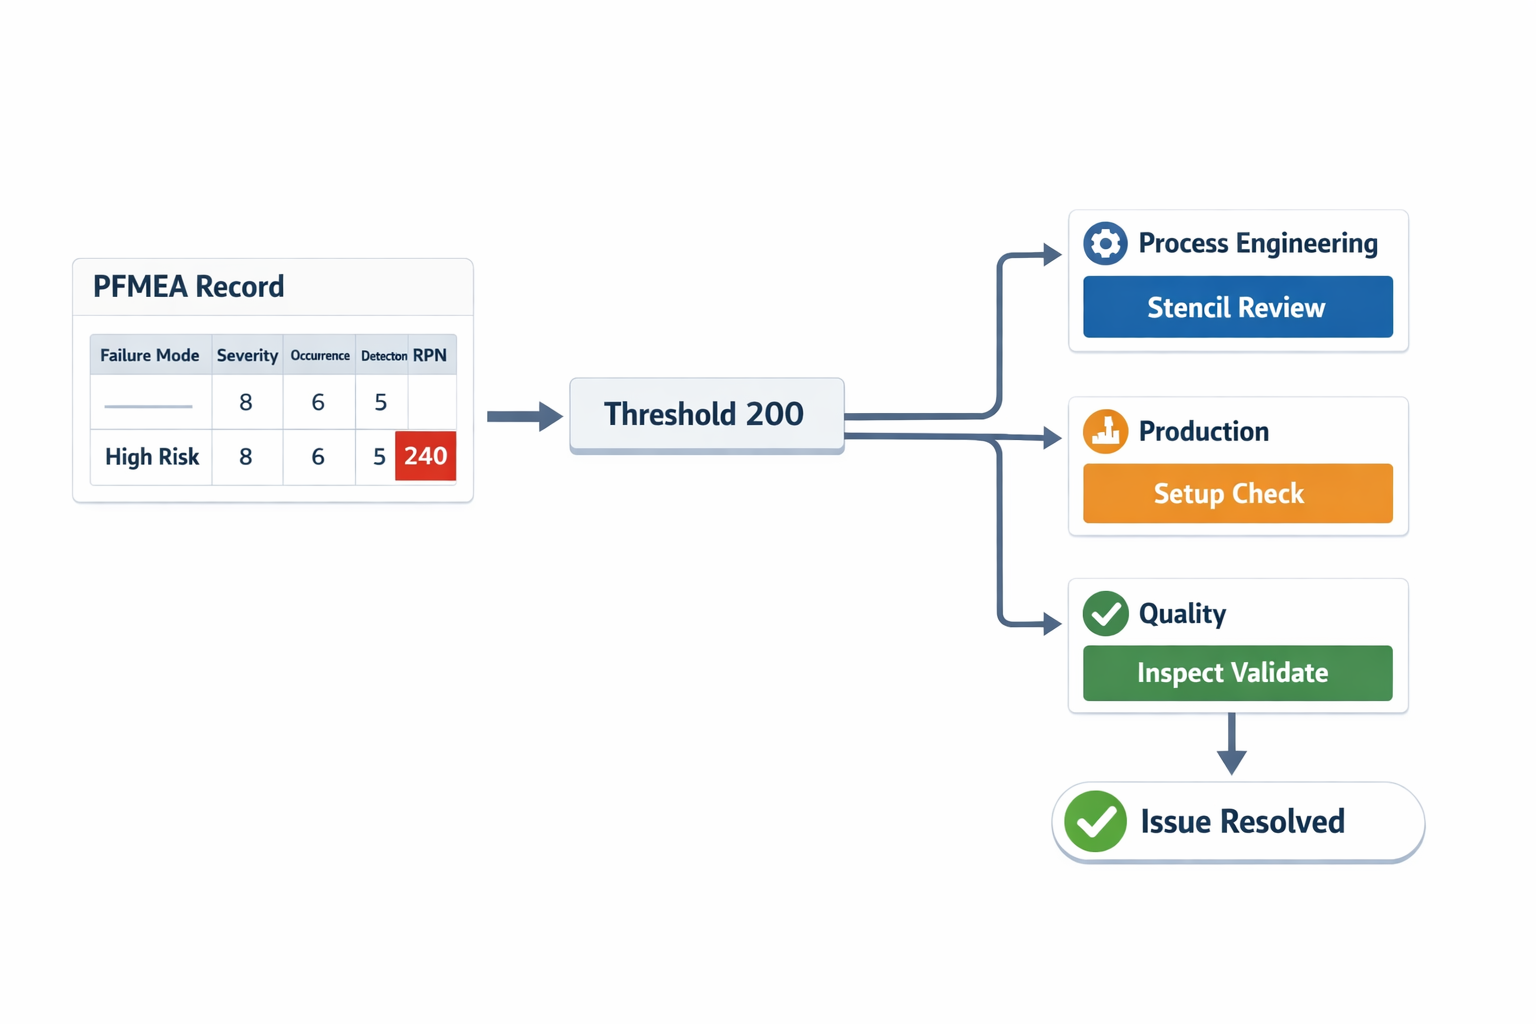
One of the simplest improvements is automatic scoring logic. In Jodoo, formula fields can handle calculating the risk priority number in FMEA by multiplying Severity, Occurrence, and Detection as soon as users enter the three ratings. That removes manual calculation errors and gives the team an immediate, consistent view of priority across the PFMEA. In the solder paste example, a Severity of 8, Occurrence of 6, and Detection of 5 instantly produces an RPN of 240.
Once that score crosses a threshold, the workflow can do more than highlight a cell. Jodoo can trigger a required corrective action plan when an RPN exceeds a defined limit, such as 200 or any plant-specific threshold. For the solder paste risk, the system can automatically assign actions to process engineering for stencil review, to production for setup verification, and to quality for inspection validation. That closes the gap between analysis and response, which spreadsheets rarely handle well.
Creating Clear Ownership Across Functions
Role-based routing is equally important. Engineering may propose reducing Occurrence through stencil redesign, while quality reviews whether SPI controls genuinely improve Detection, and production confirms operator standard work can be sustained on shift. A digital workflow lets each function review, comment, approve, or return the record in sequence, creating a traceable decision path. Instead of asking who owns the update, the PFMEA itself becomes the system of record for action, review, and closure.
Conclusion: Turn FMEA into a Repeatable Risk-Reduction System
FMEA works best when you treat it as a repeatable operating discipline, not a one-time quality document created for audits or customer requirements. For quality and process engineers, the value comes from following a clear sequence: define scope, identify failure modes, assess effects and causes, score Severity, Occurrence, and Detection consistently, and then act on the highest-risk issues first. That structure helps teams reduce defect escapes, strengthen process control, and align engineering, quality, and production around the same risk picture.
Just as important, an FMEA only creates value when actions are tracked to closure and updated as the process changes. A risk priority number is useful for prioritization, but the real improvement comes from linking high-risk items to corrective actions, ownership, deadlines, and verification results. That is where many spreadsheet-based FMEAs lose momentum.
If you want to turn FMEA into a controlled digital workflow, Jodoo gives manufacturing teams a no-code way to build custom forms, approval flows, action tracking, and dashboards around their actual PFMEA process. You can tailor it to one line or roll it out plant-wide. Start a free trial or book a demo to see how Jodoo can support your FMEA workflow.