Introduction: Why MTTR and MTBF Matter in Modern Manufacturing
In many factories, a machine stopping for 20 minutes can cost more than the repair itself once lost output, labor waiting time, and schedule disruption are added up. Unplanned downtime is a major cost driver across manufacturing, with industry estimates often putting the cost in the ribuan dolar per jam depending on the process. That is why MTTR and MTBF remain two of the most practical maintenance KPIs for plant teams that need a clearer view of downtime and equipment reliability.
For maintenance managers, plant managers, and reliability engineers, these two metrics answer different but connected questions. MTTR shows how quickly your team can restore equipment after a failure, while MTBF shows how long that asset typically runs before the next failure occurs. One measures repair efficiency; the other measures asset reliability.
Used together, they turn raw breakdown records into better downtime analysis. They help you see whether lost production is mainly caused by frequent failures, slow troubleshooting, weak spare parts readiness, or a combination of all three. In the sections that follow, we will break down what each metric means, how to calculate it, how to track both accurately, and how to use them to support better maintenance decisions across manufacturing environments.
MTTR vs MTBF: What Each Metric Measures
Purpose: Repair Speed vs Reliability
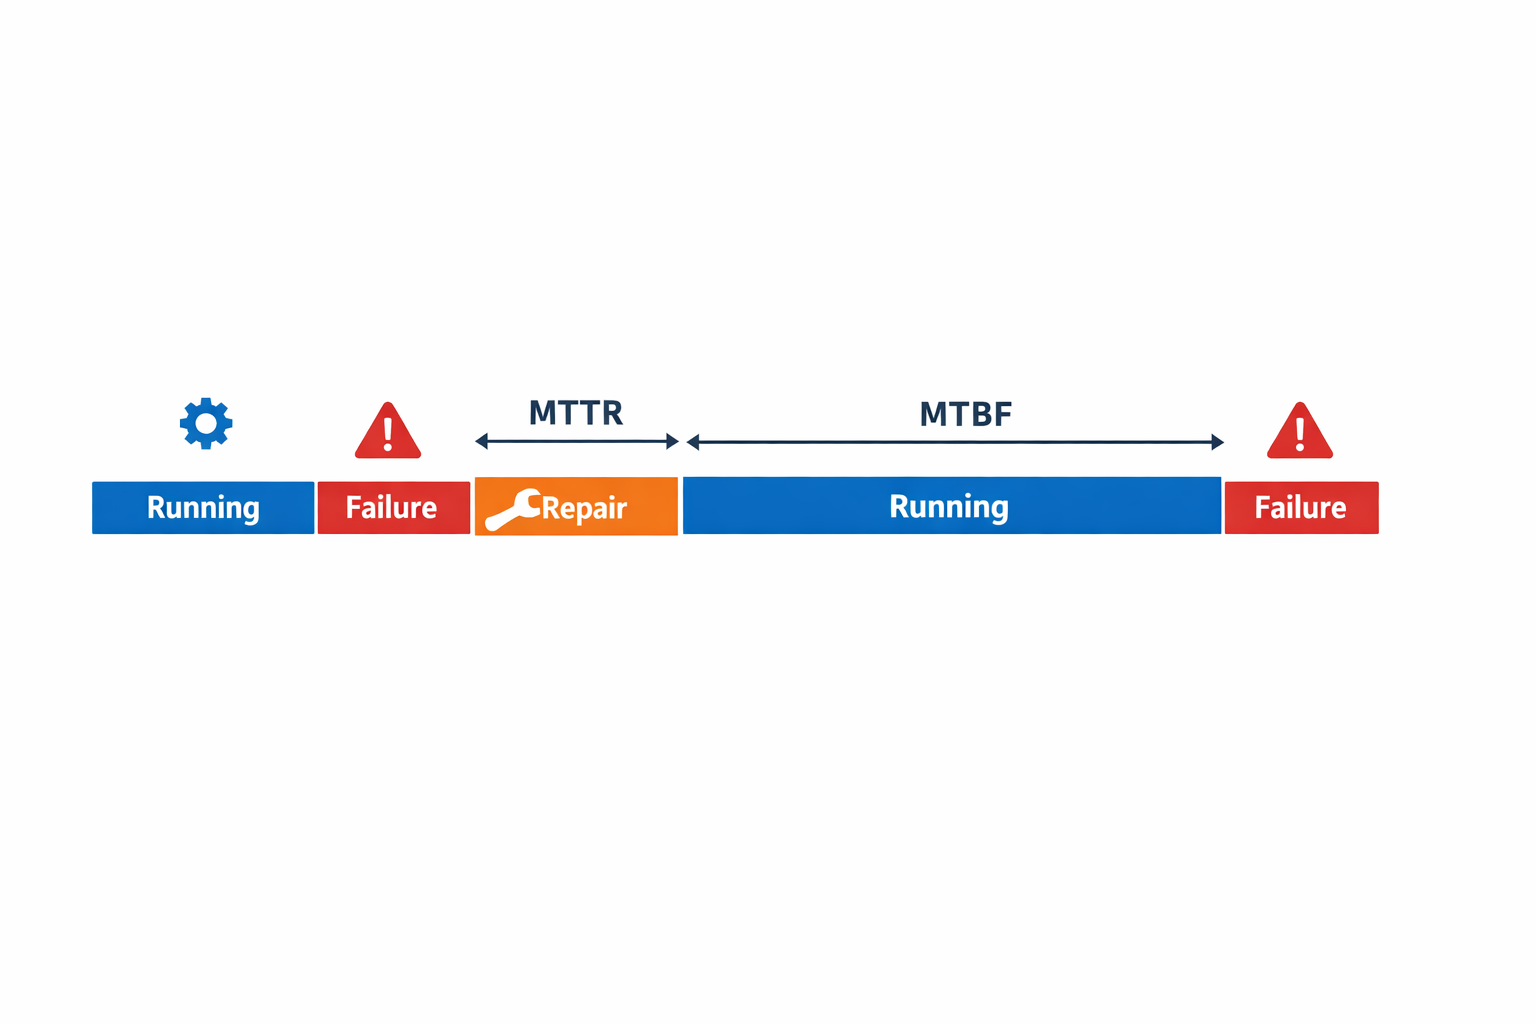
In the MTTR vs MTBF comparison, the simplest distinction is this: MTTR measures how quickly your team restores equipment after a failure, while MTBF measures how long that equipment typically runs before the next failure. One is a maintainability metric, and the other is a reliability metric. Both are core maintenance KPIs, but they answer different management questions on the shop floor.
If an automotive assembly station stops because of a sensor fault, MTTR tells you how efficiently maintenance diagnosed, fixed, and returned the station to production. If that same station fails three times in one week, MTTF tells you the asset is not running reliably, even if each repair is fast. That is why repair efficiency and reliability should never be treated as the same thing.
What Counts in MTTR
MTTR focuses on the repair window after a breakdown has already happened. In most manufacturing environments, this includes the time from when maintenance begins corrective action to when the machine is restored to normal operating condition. Depending on your internal standard, it may also include diagnosis, waiting for access, replacement, testing, and restart verification.
For example, in a food and beverage packaging line, a faulty sealer may stop production for 50 minutes. If 35 minutes were spent diagnosing the heating element issue and 15 minutes were spent replacing and testing the part, that full repair duration would typically feed into MTTR. The point of the metric is to show how efficiently the team can recover from failure, not how often the failure occurs.
What Counts in MTBF
MTBF focuses on the operating time between one failure and the next failure. It applies to repairable assets, such as conveyors, test rigs, fillers, compressors, or assembly robots that are expected to run, fail, get repaired, and return to service. The metric looks at productive runtime, not the repair duration itself.
Take an electronics testing cell that runs for 240 hours over several shifts and records four functional failures during that period. MTBF reflects the average runtime between those failures. In practical downtime analysis, this helps reliability engineers see whether the asset is fundamentally stable or whether recurring faults are shortening production uptime.
When MTTR Is Most Useful on the Shop Floor
MTTR is most useful when you are trying to improve response speed, troubleshooting discipline, spare parts readiness, and technician effectiveness. A high MTTR may point to poor fault isolation, long approval delays, missing spares, or restart procedures that take too long. It is often one of the fastest maintenance KPIs to act on because process changes can reduce repair time even before deeper reliability work is complete.
For plant managers, MTTR is especially useful during shift reviews and daily production meetings. If downtime events are unavoidable in the short term, reducing the time to recover can still protect output. This is why MTTR often appears in frontline maintenance dashboard reporting and daily loss reviews.
When MTBF Is Most Useful on the Shop Floor
MTBF is most useful when you need to understand asset reliability over time. If a machine is repaired quickly but keeps failing every few days, the maintenance team may look responsive on paper, while production still loses capacity. A low MTBF usually signals recurring defects, weak preventive maintenance, design issues, operating condition problems, or unresolved root causes.
For example, if a palletizer in a beverage plant repeatedly trips after only short operating runs, MTBF helps quantify that instability in a way that downtime totals alone cannot. It gives maintenance and operations a common basis for deciding whether the issue needs root cause analysis, component redesign, or changes to operating conditions. Among equipment reliability metrics, MTBF is one of the clearest indicators of whether reliability is actually improving.
MTTR and MTBF Formulas, With a Simple Maintenance Example
The Two Formulas You Actually Need
For practical maintenance KPI tracking, the formulas are straightforward. MTTR = Total Repair Time ÷ Number of Repairs, while MTBF = Total Operating Time ÷ Number of Failures. In the MTTR vs MTBF discussion, the key is not the math itself but making sure you divide the right time by the right event count.
A Simple Example From One Production Asset
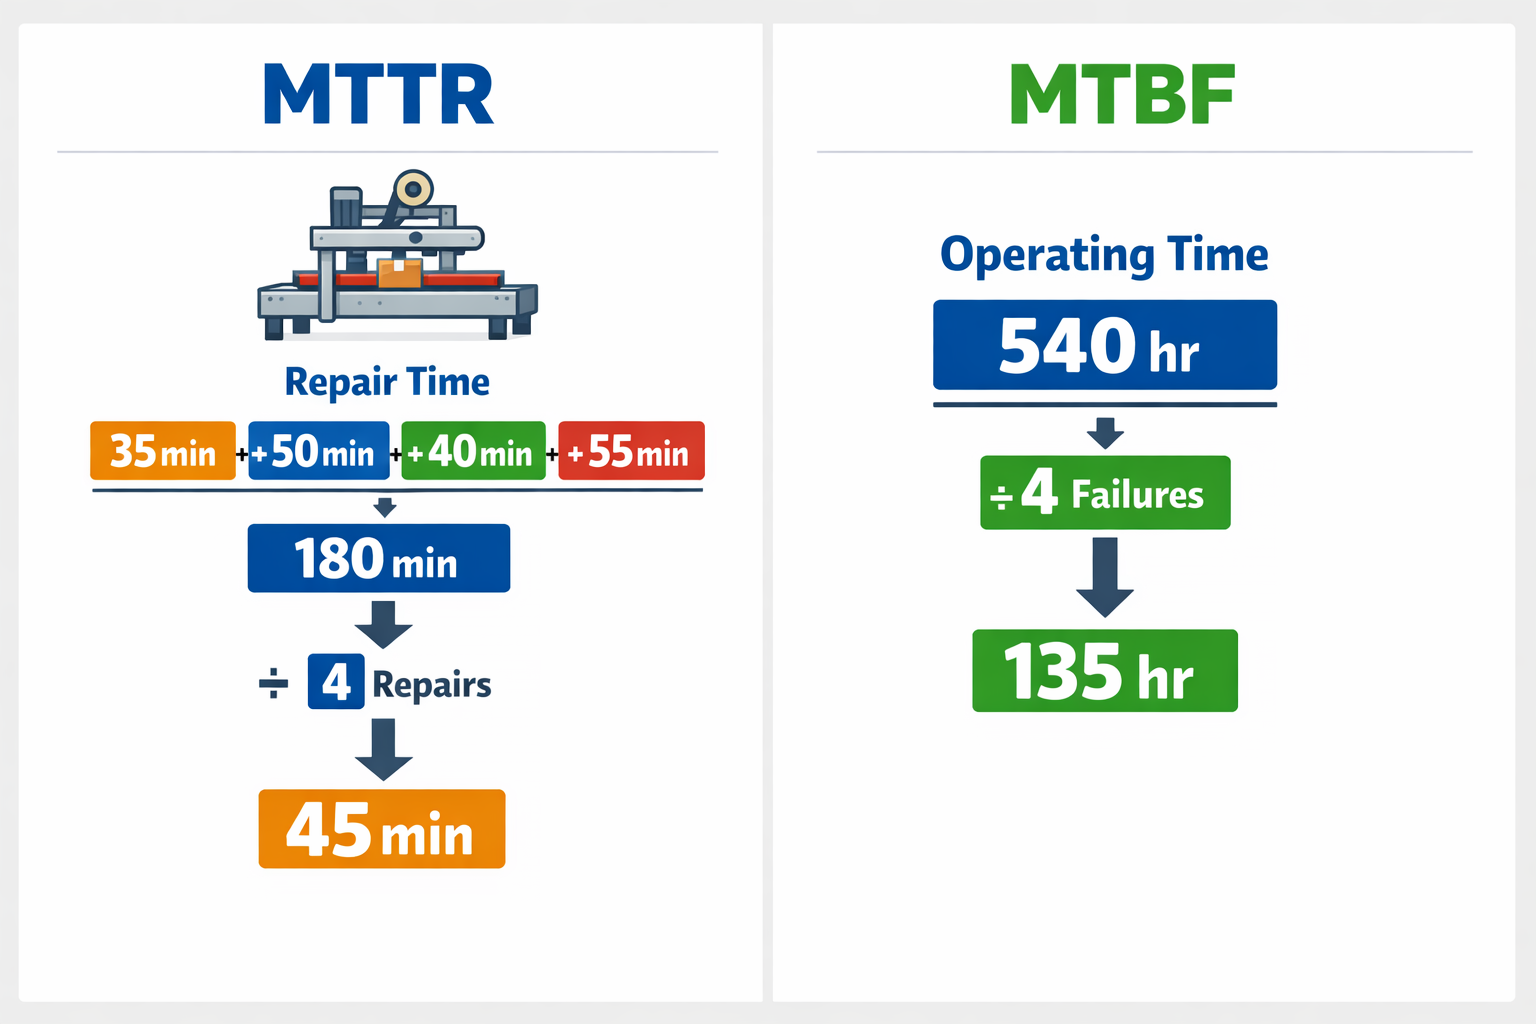
Take one carton sealing machine on a packaging line for over 30 days. During that month, the machine failed 4 times, and the maintenance team logged repair durations of 35 minutes, 50 minutes, 40 minutes, and 55 minutes. Over the same period, the machine recorded 540 operating hours between those failures.
Calculate MTTR First
Add the repair durations: 35 + 50 + 40 + 55 = 180 minutes. Then divide by the 4 repairs, which gives an MTTR of 45 minutes. That tells you the average mean time to repair for that asset during the period.
Then Calculate MTBF
Now use the operating time data. Divide 540 operating hours by 4 failures, and the result is an MTBF of 135 hours. In plain terms, that machine ran an average of 135 hours between failures.
How to Read the Numbers Together
This is where mean time to repair vs mean time between failures becomes useful for downtime analysis. An MTTR of 45 minutes may be acceptable if spare parts are nearby and changeovers are simple, but an MTBF of 135 hours may still signal too many stoppages if the line runs two or three shifts. Looking at both equipment reliability metrics together helps you judge whether the bigger issue is repair speed, failure frequency, or both.
What These Metrics Mean for Availability Reporting
These numbers also support broader maintenance dashboard reporting. When MTBF rises and MTTR falls, asset availability usually improves because the machine runs longer and returns to service faster after each failure. That is why many plants track these maintenance KPIs side by side with uptime, downtime hours, and unplanned stop counts rather than in isolation.
How MTTR and MTBF Work Together in Maintenance KPI Tracking
Why You Need Both Metrics
In practice, MTTR and MTBF are not competing maintenance KPIs. They answer two different questions that matter at the same time: how often equipment fails, and how quickly your team restores it. If you track only one, you can miss the real cause of lost production. A line can look reliable until repair time is examined, or it can look responsive while recurring failures continue to drain output.
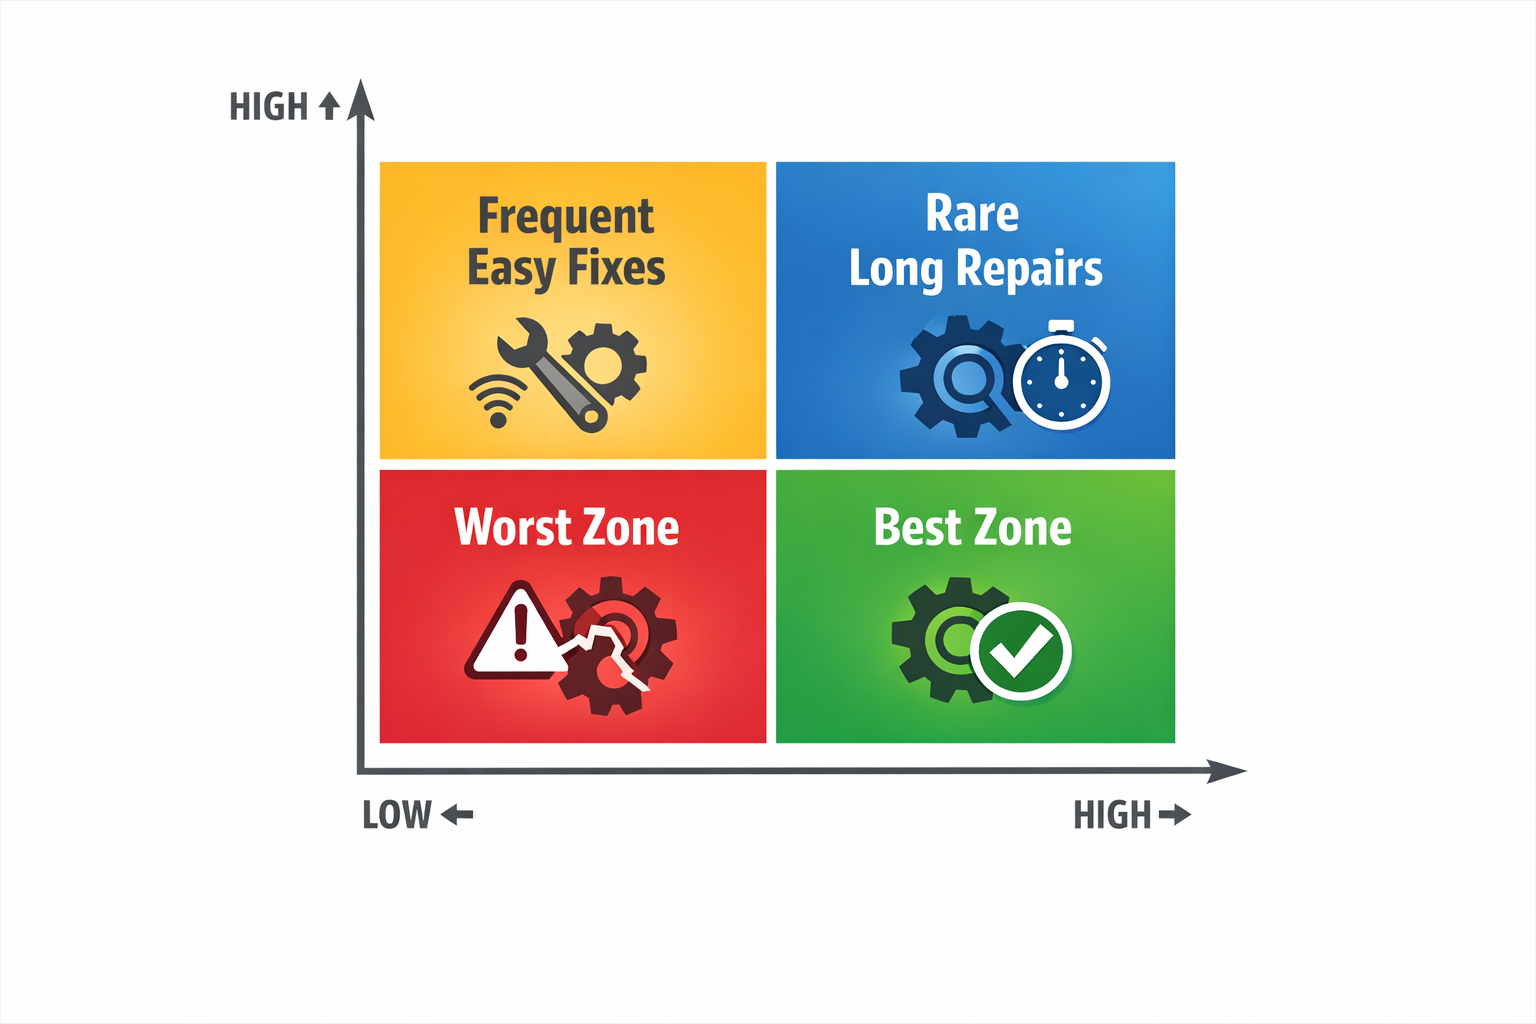
A simple way to read MTTR vs MTBF is as a performance pattern. Low MTBF and low MTTR usually mean failures are frequent but easy to fix, such as repeated sensor contamination on a packaging line. High MTBF and high MTTR point to rare but disruptive failures, such as a gearbox issue that takes hours to diagnose and repair. Low MTBF and high MTTR are the most damaging combination because the asset fails often and stays down too long each time.
How the Combination Improves Downtime Analysis
Looking at mean time to repair and mean time between failures together makes downtime analysis more actionable because it separates reliability issues from maintainability issues. If MTBF drops while MTTR stays stable, the maintenance team may be repairing equipment efficiently, but the asset or process is generating too many failures. If MTTR rises while MTBF stays healthy, the problem may sit in troubleshooting time, spare parts access, technician skill coverage, or escalation delays rather than machine condition.
This distinction matters when you review line losses with production and engineering teams. For example, an electronics test station may show acceptable overall uptime, but a closer look reveals short stoppages happening several times per shift. In that case, MTBF exposes the instability pattern, while MTTR shows whether technicians are containing the impact quickly or whether each event is expanding into larger downtime.
Add Context Before Making Decisions
Neither metric should be reviewed in isolation from failure history. A falling MTBF can mean different things depending on whether the same fault repeats, several different components are failing, or operating conditions change after a product mix shift. Likewise, a worsening MTTR may reflect more complex failures, but it can also point to poor work order handoff, missing standard repair steps, or long waits for approvals and spare parts.
That is why strong equipment reliability metrics are usually reviewed as a set, not as a single number. Maintenance leaders often compare MTTR and MTBF with repeat-fault counts, top downtime causes, backlog age, and asset criticality. This helps teams avoid the common mistake of treating every downtime spike as a maintenance execution problem when the root cause may be design weakness, operator practice, or unstable utilities.
Separate Planned and Unplanned Downtime
A common reporting mistake is mixing planned stoppages with failure-related downtime. When planned changeovers, sanitation windows, or scheduled inspections are blended into repair records, MTTR becomes inflated, and MTBF becomes less meaningful. For production assets, these metrics are most useful when they focus on unplanned failure events and are interpreted alongside planned maintenance data, not merged with it.
A food processing plant is a good example. If a filler stops for a scheduled cleaning cycle, that event should not be treated the same way as an unexpected valve failure during a production run. Separating the two allows the maintenance dashboard to show whether lost time comes from normal operating requirements or from reliability breakdowns that need corrective action.
Use the Pattern to Decide What to Fix First
When you review trends monthly or weekly, the combined signal from MTTR and MTBF helps prioritize action. Low MTBF usually pushes attention toward root cause elimination, preventive maintenance intervals, component redesign, or operating discipline. High MTTR usually points toward faster diagnosis, better spare parts staging, improved technician response, clearer escalation rules, or more standardized repair methods.
Di sinilah letaknya maintenance dashboard becomes more useful than a single KPI table. Instead of just showing averages, it should help you see which assets combine frequent failures with long recovery times, which faults keep returning, and which shifts or lines are affected most. That view turns MTTR and MTBF from passive reporting metrics into decision tools for labor, spares, and reliability improvement.
How to Capture the Right Data for MTTR, MTBF, and a Reliable Maintenance Dashboard
The hardest part of tracking MTTR and MTBF is usually not the formula. It is getting consistent failure data from the shop floor, shift after shift, in a format you can trust. If one technician logs downtime from a machine stop, another logs from work order creation, and a third closes the job hours after the line is already running, your maintenance KPIs will look precise but tell the wrong story.
Define the Failure Event Before You Measure It
Start with a clear failure definition for each asset class. For a high-speed cartoning machine, for example, a failure might mean any unplanned stop that requires maintenance intervention and causes production loss longer than five minutes. That rule matters because MTBF depends on what you count as a true failure, and loose definitions quickly distort equipment reliability metrics.
In a running example, imagine Line 3’s cartoner stops at 10:14 AM because the infeed sensor no longer detects product consistently. The operator reports the stop through a digital form, selects the asset ID, and chooses a downtime category such as electrical fault, mechanical fault, or sensor issue. That first record creates the anchor point for later downtime analysis because it establishes when the failure occurred and how the event should be classified.
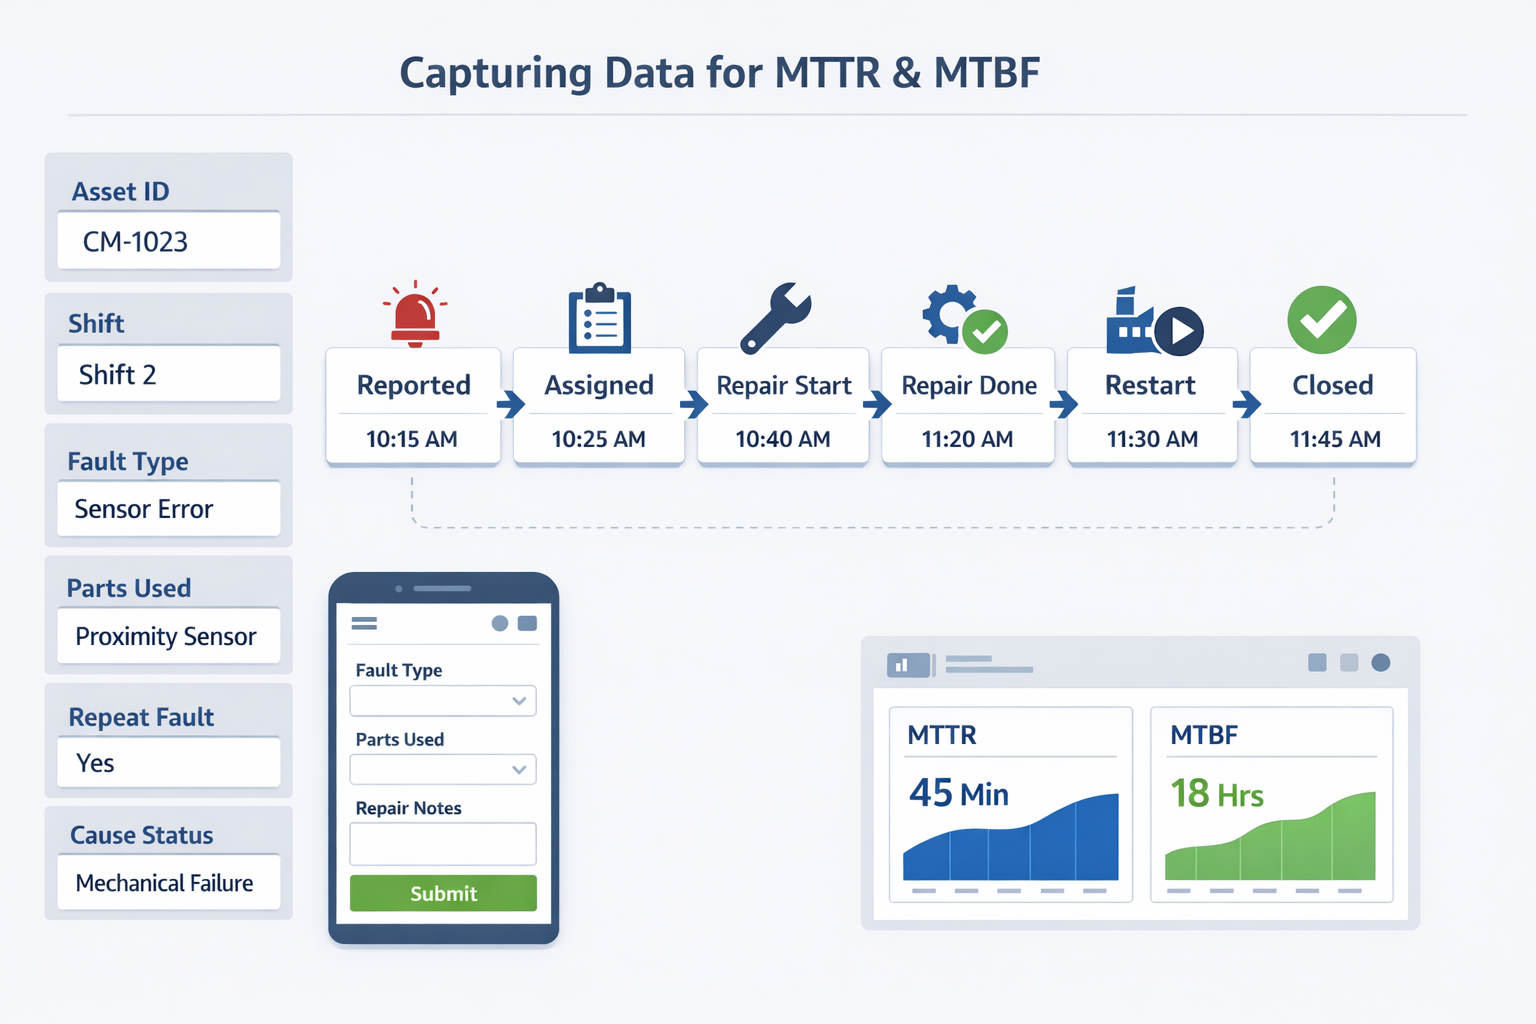
Capture the Core Timestamps in Sequence
For reliable mean time to repair and mean time between failures tracking, every failure record needs the same minimum timestamps. At a practical level, you need failure detection time, maintenance response time, repair start time, repair complete time, and production restart time. Some plants use only start and finish, but separating these stages helps you see whether delays come from notification, diagnosis, parts waiting, or the repair itself.
For the cartoner event, the operator reports the stop at 10:14 AM, the technician acknowledges it at 10:19 AM, repair starts at 10:26 AM, the faulty sensor is replaced and tested by 10:48 AM, and the line returns to stable production at 10:52 AM. With that structure, your team can decide exactly which interval belongs in MTTR and which belongs in broader downtime reporting. It also prevents the common spreadsheet problem where one cell labeled “end time” mixes repair completion with production restart.
Standardize the Required Fields and Workflow Stages
Accurate KPI tracking depends on structured fields, not open-text notes alone. Each failure record should include asset name or ID, line, shift, failure type, downtime reason code, reported time, repair start, repair finish, restart confirmation, technician assigned, action taken, parts used, repeat failure flag, and failure cause status, such as temporary fix or permanent correction. Just as important, the workflow should move through clear stages such as reported, assigned, under repair, tested, and closed, so status changes are time-stamped automatically rather than remembered later.
In the same cartoner example, the technician records that the sensor cable showed intermittent signal loss, replaces the sensor, secures the connector, and marks the event as a repeat issue because the same fault appeared twice in the last 30 days. That detail changes the value of the record. It is no longer just one downtime entry for a maintenance dashboard; it becomes a usable failure history that supports root cause review and better MTTR vs MTBF interpretation.
Make Downtime Codes Useful, Not Overcomplicated
Many factories fail here by creating either three vague codes or two hundred overly detailed ones. A useful structure usually has two levels: a broad category for reporting consistency and a narrower cause code for engineering follow-up. For example, the cartoner stop could be coded under Controls/Sensors at the category level, and photoelectric sensor signal loss at the cause level.
This approach makes dashboards easier to read while preserving enough detail for action. Plant managers can see whether electrical issues or mechanical jams are driving most downtime, while reliability engineers can drill into repeat sensor failures on one line. Without this coding discipline, downtime analysis becomes a manual interpretation exercise instead of a reliable operating system.
Record Technician Actions and Failure History at Closure
Closing the record should do more than mark the job done. The technician or supervisor should confirm what was found, what was repaired, whether the fault was temporary or permanent, what spare parts were consumed, and whether follow-up work is needed. That closure data is what turns raw downtime events into decision-grade maintenance history.
In the cartoner case, the final closure notes show a 26-minute repair window, one sensor replacement, one connector adjustment, and a recommendation to inspect cable routing during the next planned maintenance stop. Over time, records like this reveal whether a falling MTBF is linked to chronic component weakness, installation issues, or delayed preventive work. That is where maintenance KPIs become operationally useful instead of just reportable.
Why No-Code Workflows Beat Spreadsheet Logging
Spreadsheets can store downtime data, but they do a poor job of enforcing sequence, mandatory fields, and timestamp accuracy across shifts. A no-code workflow can require the operator to log the failure before a technician is assigned, trigger status-based time stamps automatically, and prevent closure until cause codes and repair actions are completed. That kind of process control improves data quality without asking maintenance teams to do more manual admin work.
This is where a platform like Jodoo fits naturally into maintenance tracking. A team can build mobile failure forms, role-based repair workflows, and a maintenance dashboard that pulls the same structured record from report to closure, instead of reconciling operator logs, technician notes, and spreadsheet summaries at month-end. The immediate benefit is not just cleaner reporting on mean time to repair vs mean time between failures, but more credible data for day-to-day decisions.
Conclusion: Turn MTTR and MTBF Into Action With Jodoo
MTTR and MTBF are most useful when you track them together, not in isolation. MTTR tells you how quickly your team restores equipment after a failure, while MTBF shows how reliably that asset runs before the next breakdown. When both metrics are defined consistently and reviewed against real failure history, they give maintenance and operations leaders a clearer view of whether the main problem is poor reliability, slow response, or both.
What matters next is execution. If failure reports, repair timestamps, and technician notes still sit in paper logs or disconnected spreadsheets, your maintenance KPIs will always be late, incomplete, or disputed. A digital workflow makes these metrics more trustworthy and easier to act on across lines, shifts, and plants.
Jodoo helps manufacturers build that workflow without heavy custom development. As a no-code lean manufacturing platform, it can capture downtime events, repair actions, start and finish times, reason codes, and recurring fault history in one connected system, then surface MTTR and MTBF on real-time dashboards. For example, a packaging plant can replace spreadsheet-based downtime logs with mobile forms and automated status changes, giving managers clearer KPI visibility across every line.
If you want to standardize maintenance tracking and turn MTTR and MTBF into faster decisions, mulai uji coba gratis atau pesan demo bersama Jodoo.