Introduction: Why Production Monitoring Matters on Today’s Shop Floor
A common factory problem is this: by the time the end-of-shift report shows a shortfall, the chance to recover output is already gone. That matters because unplanned downtime typically costs industrial manufacturers 5%에서 20%까지 of productive capacity, and much of that loss is only visible after the fact when reporting is delayed. Production monitoring means tracking what is happening on the shop floor as work moves through the line, so supervisors can act during the shift, not after it.
For production managers, that visibility is rarely about one number alone. Hitting output targets depends on seeing how finished quantity, WIP between stations, downtime events, defect rates, operator status, and order progress affect one another in real time. Without that connected view, teams often rely on whiteboards, spreadsheets, or verbal updates that are too slow to support effective production tracking.
This article focuses on a practical question: how do you build real-time shop-floor visibility without turning the discussion into a full MES or smart factory project? The sections that follow break down what to track, how live monitoring improves daily decisions, how to structure reporting workflows, and what to look for in a flexible production monitoring system.
What a Production Monitoring System Should Track in Real Time
Output and Target Attainment by Line and Time Window
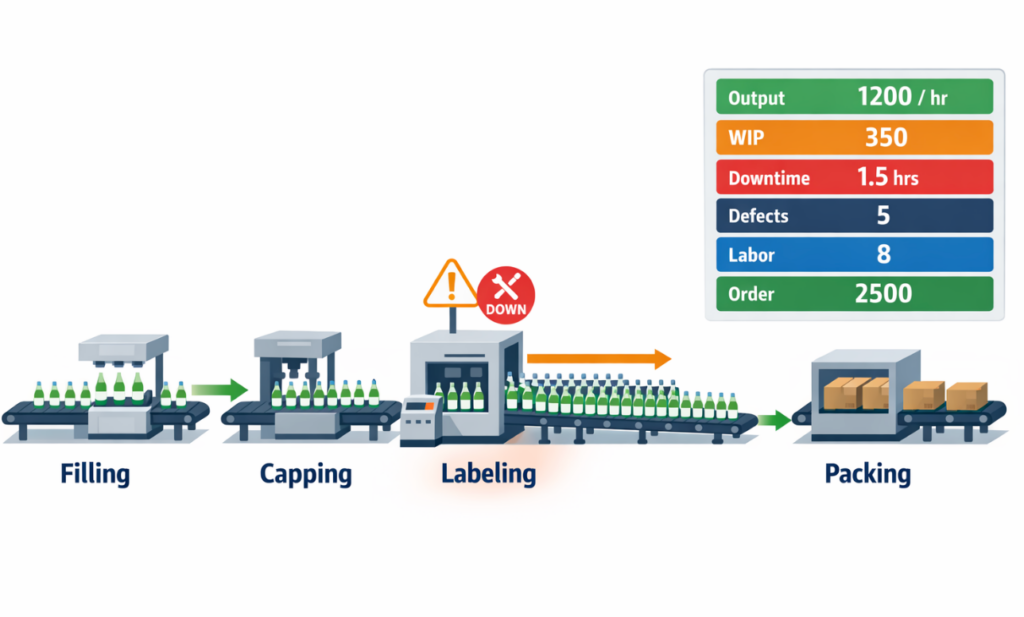
A production monitoring system should start with the most basic question on the shop floor: how much has the line produced versus how much it was supposed to produce by now. On a packaging line filling bottled beverages, that means tracking actual output by hour, shift, and order against the planned rate, not just the total at the end of the day. If the target is 4,800 bottles per hour and the line delivers 4,200, the gap needs to be visible immediately so supervisors can act before the shift falls behind. This is the core of real-time production tracking because it turns production from a historical number into a live control point.
Target attainment should also be broken down by machine, line, and SKU when changeovers affect speed. A line may appear acceptable at the shift level while one product run is already underperforming against its standard cycle time. Good shop floor monitoring therefore shows both cumulative output and the current run rate, so managers can separate a temporary slowdown from a structural problem. Without that view, production status visibility is incomplete even if total units are being reported.
WIP Between Stations
Once the output is visible, the next category is work in process between stations. On the same beverage line, bottles may move well through filling but start queueing before capping or labeling, creating a growing buffer that hides the real constraint. A production monitoring system should capture WIP counts or queue status at key handoff points, because excess buildup usually appears before missed output does. In many factories, this is the earliest signal that flow is breaking.
WIP matters because it links physical movement to performance loss. If filler output remains high while labeled finished units drop, the issue is not overall demand or labor attendance but a blockage inside the line. When operators, supervisors, and planners can see output, WIP, downtime, and defects together, they get one operational picture instead of four disconnected reports.
Downtime and Reason Codes
After output and WIP, the system needs to capture downtime in a structured way. On the beverage line, if the labeler stops for 12 minutes due to sensor misalignment, the lost time should be logged immediately with a reason code rather than written on paper later. Short stops matter here as much as major breakdowns, because repeated micro-stoppages often reduce hourly attainment without appearing dramatic on a shift report. Real-time shop floor monitoring becomes far more actionable when downtime is tied to duration, asset, cause, and response status.
Reason codes should be practical enough for operators to use consistently. Categories such as material shortage, changeover, mechanical fault, quality hold, and waiting for maintenance are usually more useful than vague labels like “machine issue.” Over time, this production data collection creates a loss profile that helps supervisors distinguish between chronic equipment instability and process discipline problems. The value is not just in recording stoppages, but in making the source of lost capacity visible while the shift is still running.
Defects and Rework
A line can hit output targets and still destroy margin if too much product is rejected 또는 reworked. On the beverage line, damaged caps, incorrect labels, or underfilled bottles should be recorded at the point where they are found, with quantity and defect type captured in real time. If defect counts rise while WIP also increases, the problem may be creating both quality loss and flow disruption at the same time. That connection is why defects cannot sit in a separate quality report if the goal is real production status visibility.
Rework should be tracked separately from first-pass good output. Otherwise, the line may appear productive simply because units are being touched twice. A useful production dashboard distinguishes total processed units, good units, rejected units, and reworked units so managers can see whether the line is truly converting material into saleable output. For many plants, first-pass yield is one of the clearest indicators of whether the line is stable or quietly consuming capacity.
Labor and Shift Status
Once flow and loss points are visible, the system should show who is available to run the line and under what conditions. On the same line, being one operator short at the case-packing station or running with a newly transferred worker can explain why output recovery is slower than expected after a stoppage. Labor status does not need to become a full HR system, but the shop floor should know basic execution facts such as operator assignment, shift handover status, attendance gaps, and whether support teams have responded. Without that context, line data can look worse or better than it really is.
This is especially important across shift changes, where many factories lose continuity. If the day shift leaves with a backlog of unlabeled bottles and the night shift starts with no clear update, the production dashboard may show a symptom without showing whether the problem is still active, already escalated, or waiting on materials. Even a simple live view of line staffing, shift ownership, and open issues improves response quality. In practice, labor visibility gives meaning to the numbers already being tracked.
Schedule Progress by Order
The final layer is scheduled for progress by production order, batch, or line. A beverage line may be producing steadily, but if it is behind on the current SKU needed for dispatch, overall plant performance is still at risk. A production monitoring system should therefore connect live execution data to what order is running, how much of that order is complete, and whether the line is ahead, on time, or behind schedule. This closes the loop between machine-level activity and the production plan.
For production managers, this is where real-time production tracking becomes useful beyond the line itself. Output shows what is happening now; WIP shows where flow is slowing; downtime and defects show why losses occur; labor status shows execution capacity; and order progress shows business impact. When these signals are updated in one monitoring view, supervisors do not need to wait for end-of-shift summaries to know whether intervention is required. They can see, line by line and order by order, whether execution is still aligned with the day’s plan.
How Real-Time Production Tracking Improves Manufacturing Performance
Spot Bottlenecks Before They Disrupt the Whole Line
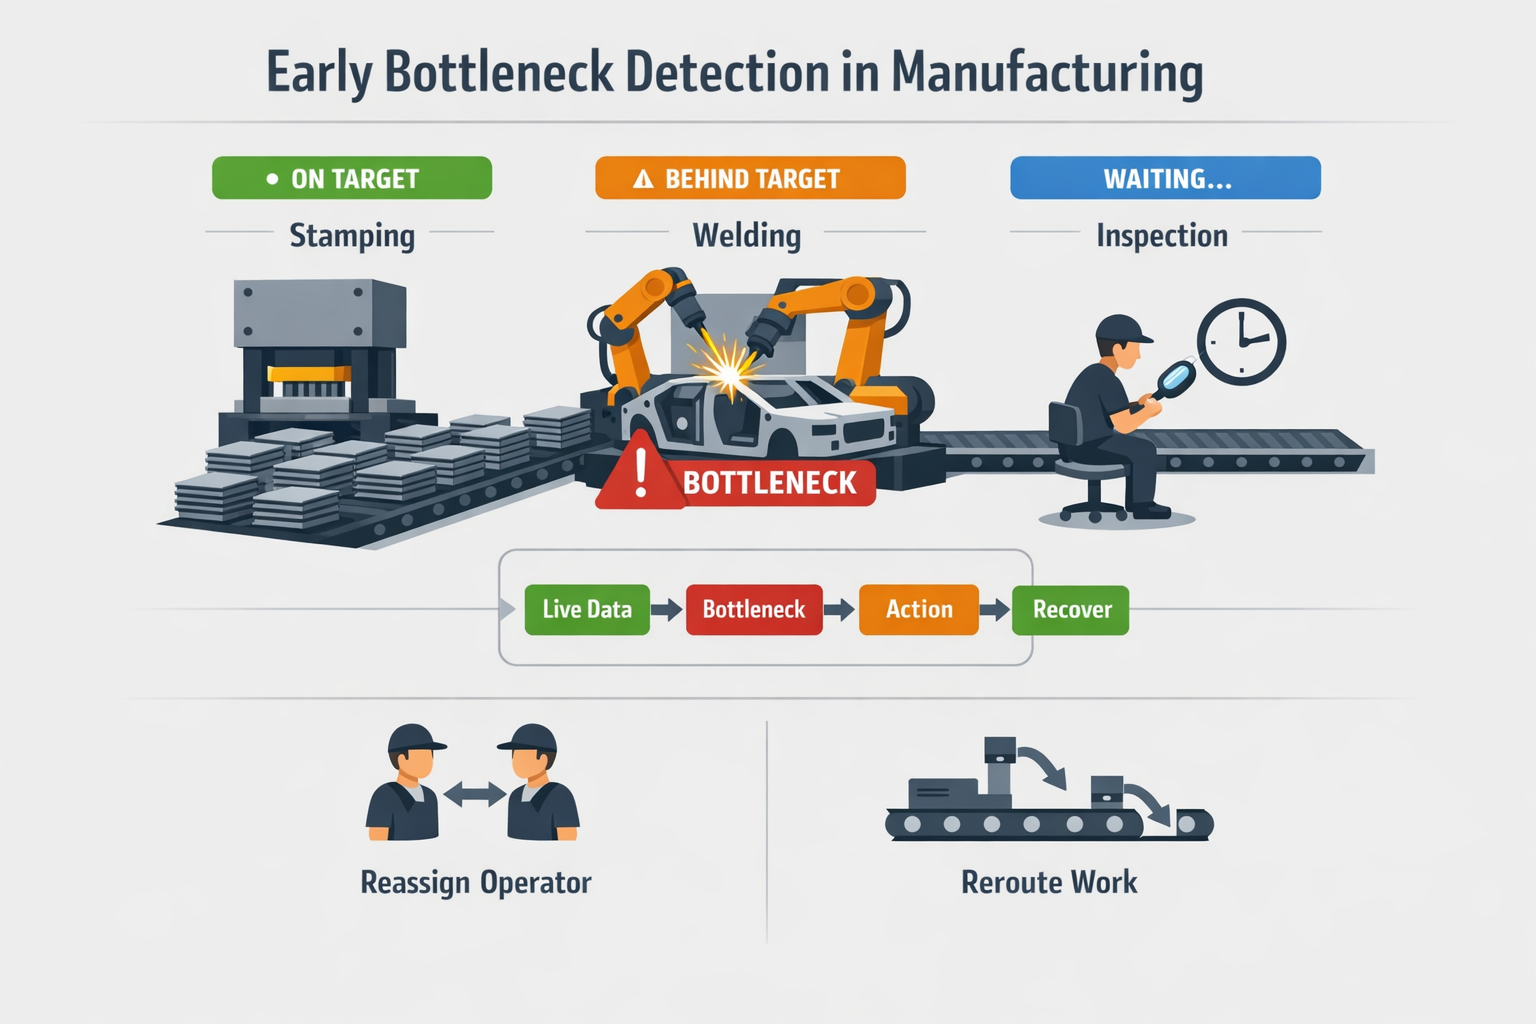
In automotive component manufacturing, bottlenecks rarely appear as a single dramatic event. More often, a supervisor sees one welding cell falling a few units behind target, while upstream stamping continues feeding parts, and downstream inspection starts waiting intermittently. With real-time production tracking, that pattern becomes visible early enough to rebalance operators, adjust changeover timing, or temporarily reroute work before queue time turns into lost output. That is where manufacturing performance monitoring becomes practical: it turns small flow disruptions into manageable decisions instead of end-of-shift surprises.
좋은 production monitoring system shortens the supervisor’s decision cycle from detection to action. When hourly output, cycle performance, and station-level queues update live, the team can confirm whether the issue is labor availability, machine speed loss, material starvation, or quality hold. Instead of reacting to a missed shift total, they act while the problem is still local to one process step. That is a major difference between basic reporting and true shop floor monitoring.
Respond to Downtime Faster With Clear Loss Signals
In an electronics assembly environment, a surface-mount line may lose only 8 to 12 minutes at a time from feeder jams, program checks, or component replenishment. Individually, these stops look minor, but repeated across a shift, they can remove more than an hour of productive time. Real-time production tracking helps supervisors see not just that the line has stopped, but how long it has been stopped, what reason code was logged, and whether support has already responded. That improves escalation discipline and prevents short stoppages from becoming invisible chronic losses.
This matters because the speed of response directly affects OEE-style performance, even if the plant is not formally managing every line through an OEE program. A production dashboard that highlights active downtime by duration and reason helps maintenance and production leaders prioritize the stoppages that are actually threatening schedule attainment. According to industry benchmarks from downtime studies, unplanned downtime can cost manufacturers 5%에서 20%까지 of productive capacity, depending on process stability and response maturity. Better production status visibility does not eliminate breakdowns, but it reduces the delay between event, recognition, and intervention.
Reduce Hidden WIP and Keep Flow Under Control
In food and beverage packaging, hidden WIP often builds up between filling, labeling, and case packing long before the line is officially considered behind schedule. If each station reports only final packed cases, supervisors may miss the fact that semi-finished product is accumulating at one transfer point while another station keeps micro-stopping. Real-time production data collection at critical points makes those imbalances visible during the shift, not after inventory reconciliation. That allows teams to protect flow, reduce waiting time, and lower the risk of scrap from overexposure or handling delays.
This is especially important in plants where shelf life, temperature window, or sanitation timing affects the economics of delay. A line can appear productive on paper while actually carrying excess WIP that ties up labor, floor space, and rework risk. With stronger shop floor monitoring, supervisors can make smaller, earlier corrections such as slowing one upstream process, releasing support to a constrained station, or adjusting batch sequence. Those decisions improve throughput quality without needing a full system redesign.
Keep Production Schedules on Track Shift by Shift
Schedule control improves when production monitoring connects actual progress to the order plan in real time. On a mixed-model line, being 3% behind at noon may be recoverable; being 3% behind on the wrong SKU with a customer shipment at 4 p.m. is a different problem entirely. Real-time production tracking gives planners, supervisors, and line leaders a shared view of which orders are advancing, which are slipping, and where intervention will have the highest impact. That makes schedule recovery more targeted and less disruptive.
In practice, this changes shift management from broad pressure to specific action. Instead of asking a line to “push harder,” supervisors can decide whether to authorize overtime on one station, resequence a short-run order, call logistics for faster replenishment, or move a trained operator to the constrained process. Plants with strong production status visibility typically recover faster because they are managing exceptions, not assumptions. That is the operational value of a well-used production dashboard: it supports decisions at the pace the factory actually runs.
From Whiteboards to Dashboards: How to Build a Practical Shop Floor Monitoring Workflow
Start With the Reporting Points That Drive Decisions
실용적인 production monitoring workflow starts by choosing a small number of reporting points that match how supervisors actually manage the line. In most plants, that means recording counts at the end of a process step, logging downtime when a machine stops beyond a set threshold, and confirming order progress at shift or batch milestones. If you try to capture everything on day one, production data collection becomes a burden and data quality drops.
For a semi-digital factory, the best starting point is usually one line, one shift pattern, and one reporting rhythm. Hourly output updates, downtime reason entry, and basic defect reporting are often enough to create useful production status visibility without overloading operators. This gives you the foundation for real-time production tracking while keeping rollout manageable.
Assign Clear Data Ownership on the Shop Floor
Every data point in a production monitoring system should have a named 소유자. Operators can enter output, stoppages, and defect counts at the station level, while line leaders or supervisors validate exceptions, missing entries, and unusual variance against the target. Without ownership, even a well-designed shop floor monitoring process becomes another incomplete spreadsheet exercise.
This is also where many implementations fail quietly: the plant adds screens, but no one defines who updates what, when, and under which conditions. A simple ownership model works better than a complex one. For example, operators submit hourly production actuals, maintenance confirms the causes for longer stops, and supervisors close the loop on escalation items before the shift ends.
Standardize the Inputs Before You Build the Dashboard
Before you design a production dashboard, standardize the way data is captured. That means fixed reporting intervals, consistent downtime reason codes, clear scrap and rework categories, and simple rules for partial completions or changeovers. If one line records “material shortage,” another records “no material,” and a third leaves the field blank, manufacturing performance monitoring will produce noise instead of insight.
In practice, standardization should make data entry faster, not harder. Mobile forms or line-side tablets should use dropdowns, auto-timestamps, prefilled order information, and mandatory fields only where they matter. The goal is to reduce free-text entry and create clean data that supervisors can trust during the shift, not just after it.
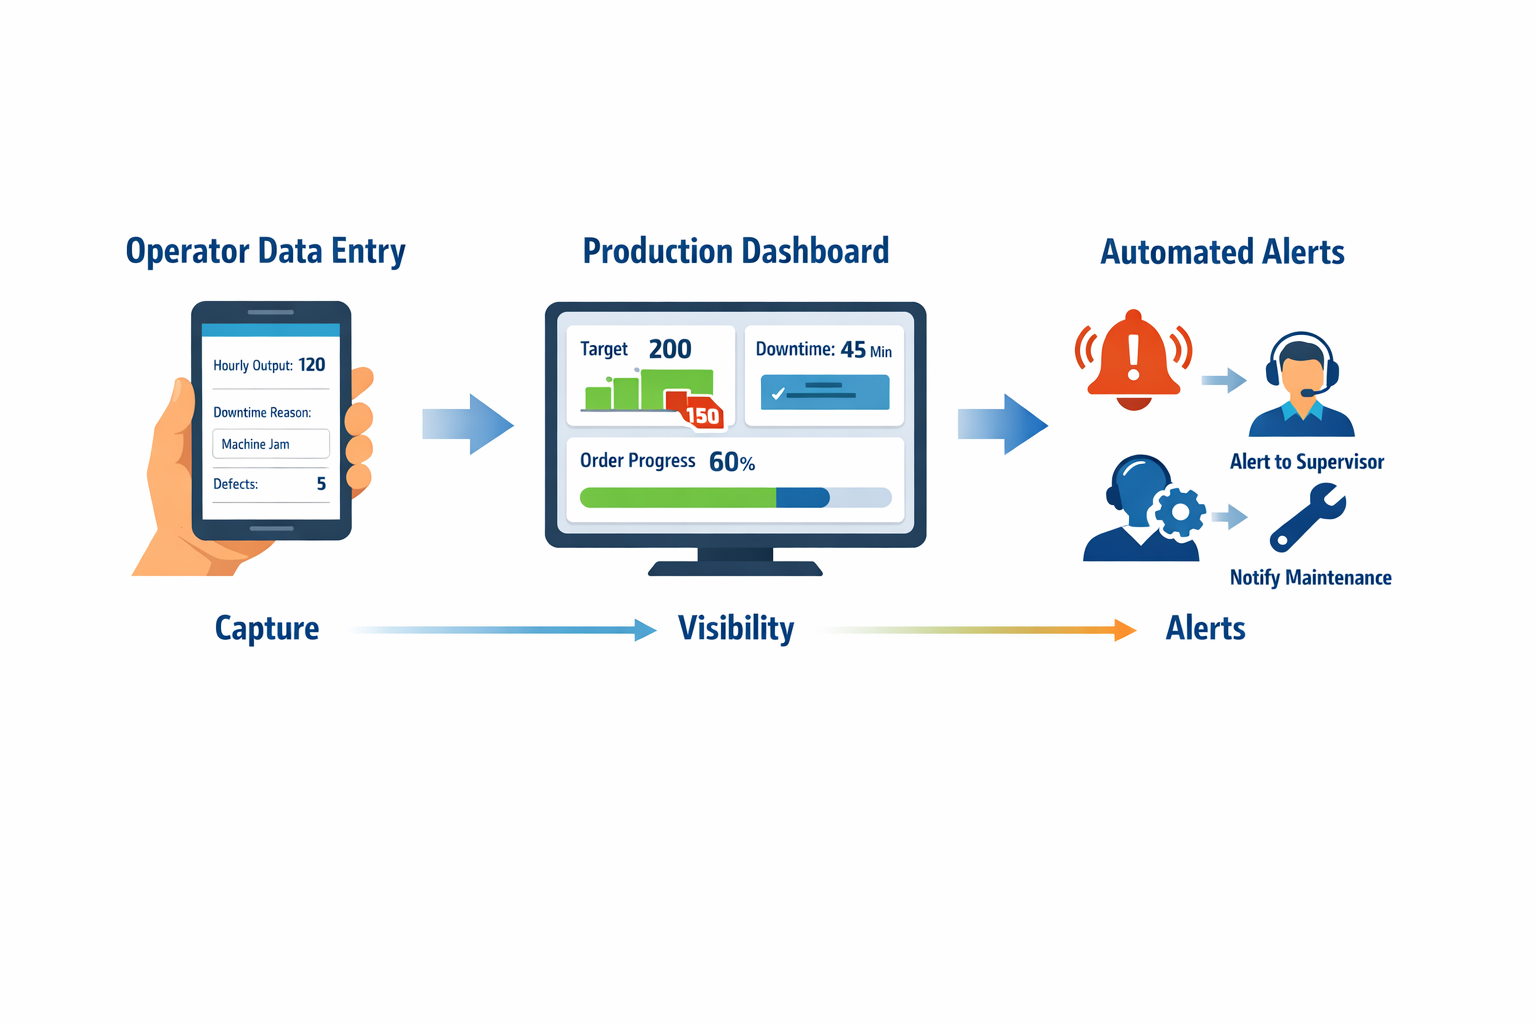
Build a Simple Flow From Data Entry to Dashboard to Alert
Once the inputs are standardized, connect them into a simple operating flow. Operators enter counts and stoppages through mobile forms or tablets; the data feeds a live production dashboard by line and shift, and alert rules trigger when output falls behind plan or downtime exceeds a threshold. This turns manual updates into a usable shop floor monitoring loop rather than a passive record-keeping exercise.
A realistic first-stage workflow does not need advanced automation. You need timestamps, order or line references, basic validation, visual status on the dashboard, and one or two escalation rules, such as notifying a supervisor after 10 minutes of unplanned stoppage. That is enough to move from delayed reporting to active production monitoring.
If you are digitizing this workflow, Jodoo can support that end-to-end structure with no-code forms for operator reporting, workflow rules for alerts and escalation, and dashboards that update by line, order, or shift. That matters for plants that want real-time production tracking without waiting for a long custom development cycle. The key advantage is not the tool itself, but the ability to configure the workflow around your existing reporting logic and then improve it gradually.
Roll Out in Stages and Tighten the Rules Over Time
The most effective rollout sequence is usually capture first, visibility second, alerts third. In week one, focus on getting reliable entries from the shop floor. Once the data is stable, build the production dashboard around a few core views such as actual vs target, open downtime events, and order progress by line.
After that, add only the alerts that drive action. Too many notifications create the same blindness as no notifications at all. A practical production monitoring system might begin with just three triggers: missed hourly target, downtime above a fixed limit, and repeated defect spikes within one shift.
Keep the Workflow Useful for Both Operators and Supervisors
A shop floor monitoring process only works when the interface fits the user. Operators need fast, low-friction entry on mobile devices or shared tablets, while supervisors need filtered views that highlight exceptions, not raw transaction lists. The same data should support both execution and management, but the screens should not look the same.
That is why role-based views matter even in an early-stage setup. An operator screen should answer, “What do I need to report now?” A supervisor’s view should answer, “Which line needs intervention now?” When production data collection and decision-making are designed together, the workflow becomes part of daily management instead of a side task.
What to Look for in Production Monitoring Software for Flexible, Real-Time Visibility
선택하기 production monitoring software is less about buying the most advanced system and more about matching the tool to how your factory actually runs. For most plants, the core question is simple: can the system capture the right production data at the point of work, show it to the right people fast, and trigger action before the shift is lost? That is the standard a practical production monitoring system should meet.
Configurable Data Capture Is a Must-Have
A useful system should let you define what operators, technicians, and supervisors need to report without forcing every line into the same template. In practice, that means flexible forms for hourly output, downtime reason codes, scrap counts, changeover status, and line-side comments. If your production data collection process cannot be adjusted by product family, work center, or shift, the software will become a workaround problem instead of a visibility tool.
This matters most in mixed manufacturing environments. A packaging line may need speed loss and film change tracking, while a machining cell may need cycle completion, tool change, and first-pass yield data. A rigid setup that only supports generic production counts will limit real-time production tracking the moment you try to expand beyond one simple line.
Role-Based Views Keep the System Usable
Different users need different levels of production status visibility. Operators need fast entry screens and clear targets, shift supervisors need exception-focused line views, and plant managers need a broader production dashboard that compares lines, orders, and shifts. If everyone sees the same crowded screen, adoption usually falls, and response time slows.
Role-based views also improve data discipline. When a technician only sees open downtime events and required response fields, the system becomes easier to use under time pressure. For manufacturing performance monitoring, simplicity at each role is often more valuable than giving every user access to every metric.
Alerts Should Support Action, Not Just Notification
Many tools can display live numbers, but fewer can turn abnormal conditions into timely action. Good shop floor monitoring software should support threshold alerts such as output falling below target for two consecutive intervals, downtime exceeding a set limit, or scrap crossing a shift-level tolerance. The value is not the alert itself, but the ability to route it to the right person with enough context to respond quickly.
A common failure point in manual reporting is that issues become visible only when someone checks a board, opens a spreadsheet, or asks for an update. Rigid systems have the opposite problem: they collect data consistently but make changes to alert logic slow or IT-dependent. A configurable monitoring workflow sits in the middle, giving you structured reporting with practical control over when and how escalation happens.
Dashboard Design Should Match How Decisions Are Made
A production dashboard should help supervisors and managers decide what to do next, not just display more charts. At the line level, that usually means live target-versus-actual output, current order status, active downtime events, WIP buildup, and defect trends in one view. At the plant level, it may mean comparing schedule attainment, OEE-related losses, and labor status across multiple lines or departments.
The best dashboard designs also allow users to move from summary to detail without leaving the workflow. For example, if a plant manager sees one line behind schedule, they should be able to drill into the downtime pattern or defect spike causing the gap. That connection between overview and root-cause detail is what separates operational visibility from static reporting.
Workflow Automation Becomes More Important as You Scale
At a small scale, a line can survive on disciplined reporting and a supervisor who watches the numbers closely. As more lines, shifts, and products are added, manual follow-up becomes inconsistent. This is where workflow automation becomes a must-have for production monitoring software, especially if your escalation rules, approvals, or cross-functional handoffs are still managed through chat messages and phone calls.
Integration Options Matter for Data Accuracy
Real-time visibility becomes more reliable when the system can connect with the tools your plant already uses. Depending on your setup, that may include ERP production orders, barcode scans, machine signals, maintenance records, or quality inspection data. Without some integration capability, teams often end up re-entering data, which weakens both trust and speed.
That does not mean every factory needs a full machine-to-system architecture on day one. Many manufacturers start with manual and semi-automated production data collection, then add integrations where the operational payoff is clear. When evaluating software, check whether it can grow from tablets and operator inputs to broader data connections without forcing a complete rebuild.
Scalability Across Lines and Plants Is a Long-Term Requirement
A pilot that works on one line is not enough if every expansion requires redesigning forms, rebuilding dashboards, and retraining users from scratch. Scalable software should let you standardize core metrics while still adapting to local process differences by line, area, or plant. That balance is critical for companies running regional operations with shared reporting needs and different production realities.
For example, a group with one plant in Thailand and another in Vietnam may want the same executive view of schedule attainment and losses, but different reporting details at the line level. A flexible production monitoring system should support both. If it cannot scale structurally, your reporting model will fragment again as deployment grows.
Conclusion: Why Jodoo Is a Practical Way to Launch Production Monitoring Faster
Effective production monitoring starts with a simple discipline: capture the right shop-floor signals, make them visible fast, and trigger action before small losses become missed output. For most factories, that means tracking output, WIP, downtime, defects, labor status, and order progress in one operational view rather than across paper sheets, spreadsheets, and delayed shift summaries. When supervisors can see changes as they happen, they can respond within minutes instead of waiting until the end of the shift.
코딩이 필요 없는 린 제조 플랫폼으로서, Jodoo lets your team build mobile reporting forms, digital work orders, escalation workflows, and real-time dashboards without a long custom software project. An electronics assembly team, for example, can use tablets or phones to submit hourly counts, log downtime by reason code, and update line status live, while supervisors receive alerts and view schedule risk on one dashboard.
If you want to launch production monitoring faster without a heavy MES rollout, Jodoo gives you a flexible way to digitize the workflow around your actual operations. You can 무료 체험을 시작하세요 또는 데모 예약하기 to see how it fits your plant.