Browse by category

Introduction: Why Statistical Process Control Matters Before Defects Reach the Customer
A defect found at final inspection is expensive. A defect found by the customer is worse. According to ASQ, the cost of poor quality can reach 15% to 20% of sales revenue in many organizations, and much of that loss comes from catching problems too late. That is why Statistical Process Control (SPC) matters: it helps manufacturers spot process variation while production is still running, before scrap, rework, complaints, or line stoppages spread.
This guide explains the basics of SPC, how to read SPC control charts correctly, and how to use those signals in daily operations. It also shows how digital workflows can help your team respond faster when a process starts to move out of control.
What SPC Is and How to Use It to Reduce Variation and Defects
SPC Focuses on the Process
Statistical Process Control is a method for monitoring process behavior over time so you can detect abnormal variation before it turns into scrap, rework, or customer complaints. Instead of asking only whether a finished part passed inspection, SPC asks whether the process that produced it is behaving predictably. That shift matters because a process can still produce parts within tolerance for a period of time while already drifting toward failure.
SPC looks at measurements in sequence, which helps quality engineers and production managers see whether the process is stable, drifting, or responding to a disturbance. That is the foundation for understanding SPC control charts later in the article, but the principle is straightforward: quality is more reliable when you control variation at the source. In other words, SPC is less about catching bad parts and more about preventing them.
Why Variation Is the Real Signal
Every manufacturing process varies to some degree, even when machines are maintained and operators follow standard work. A stamping press may produce slight dimensional differences between parts, a filling line may vary by a few grams, and a reflow oven may create small changes in solder joint appearance across a shift. The goal is not to eliminate all variation, which is impossible, but to separate normal variation from the kind that signals a process problem.
Manufacturers usually divide variation into two types: common-cause variation and special-cause variation. Common-cause variation is the natural fluctuation built into a stable process, such as minor temperature changes, normal machine vibration, or routine material differences within an approved range. Special-cause variation comes from a specific, identifiable disruption, such as a worn tool, a wrong machine setting, a clogged nozzle, or an untrained operator changeover. If you treat common-cause variation like an emergency, you over-adjust the process; if you miss special-cause variation, defects multiply.
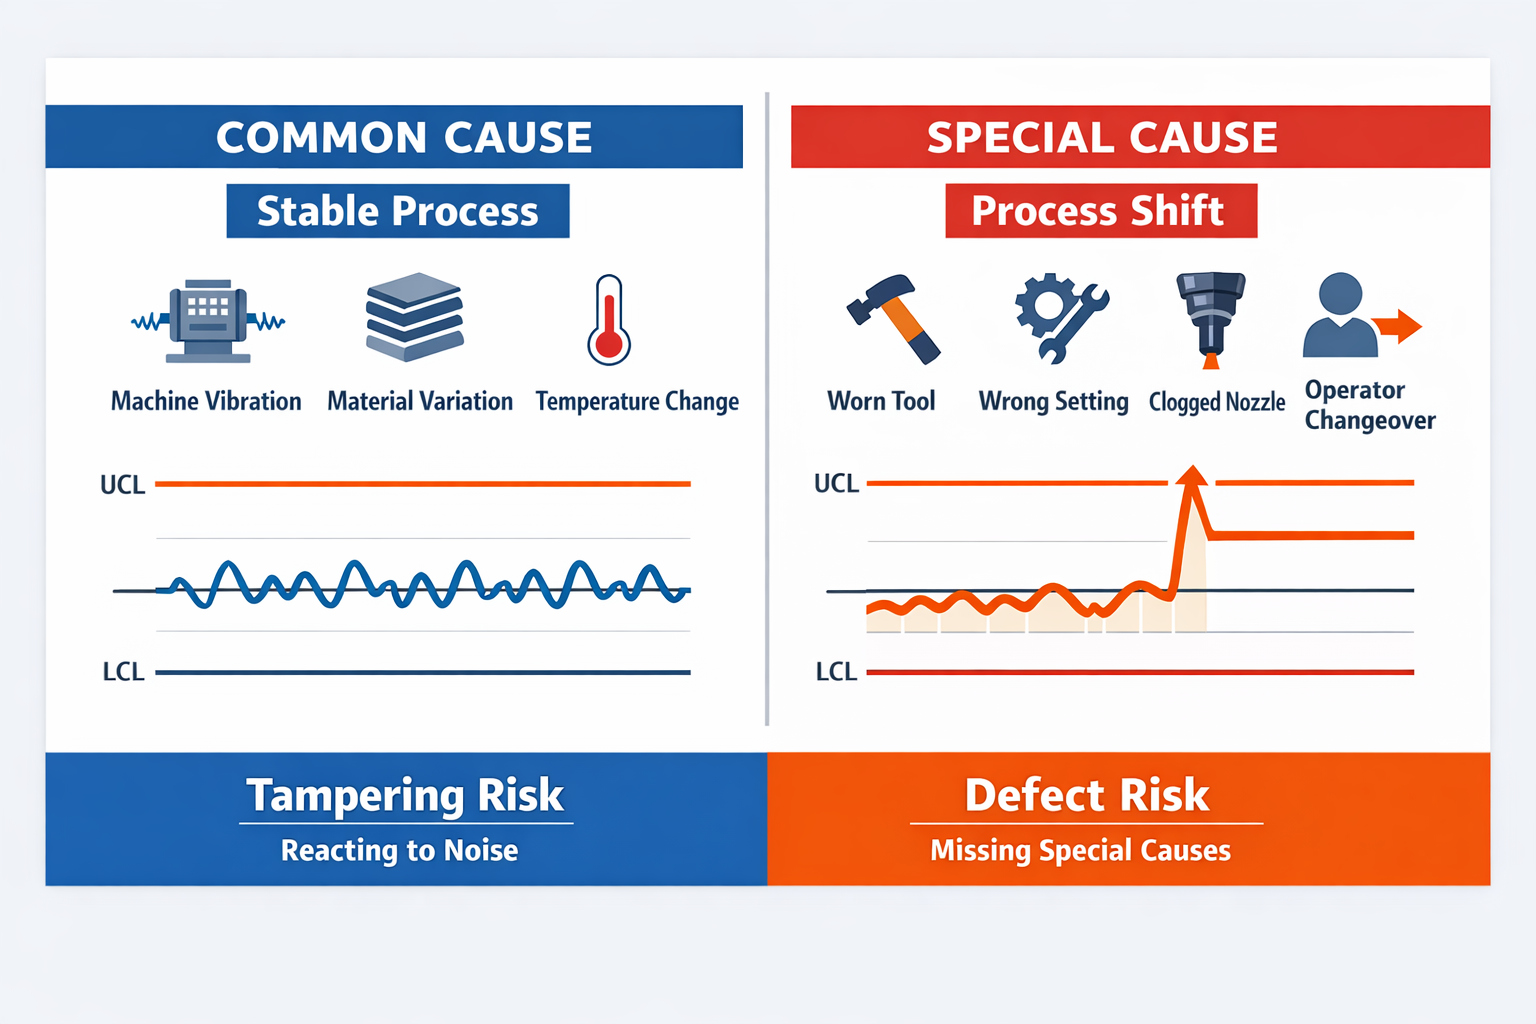
This distinction is central to how to use statistical process control effectively. Teams that react to every single data point often make the process less stable by chasing noise. Teams that ignore unusual patterns because individual parts still pass final inspection often discover the problem only after yield drops or customers reject product. SPC helps you respond to the right signal at the right time.
Why Stable Processes Produce Better Quality
A stable process shows only common-cause variation over time. Without stability, root cause analysis becomes unreliable because the process keeps changing for uncontrolled reasons. That is why manufacturers often stabilize first, then optimize.
For example, in metal stamping, a press producing hole diameters with consistent spread is easier to adjust and improve than one affected by intermittent die misalignment. In beverage filling, a line with stable fill-weight variation can be centered more accurately to reduce giveaway without increasing underfill risk. In electronics assembly, stable solder paste deposition supports better first-pass yield because the upstream process stops introducing random defects into placement and reflow.
How SPC Reduces Defects in Manufacturing
SPC helps reduce manufacturing defects by identifying drift, instability, and abnormal events early, allowing teams to act before large quantities are affected. On a PCB line, tracking solder paste height can reveal stencil wear or printer alignment issues before tombstoning and insufficient solder defects rise. On a packaging line, monitoring fill weight can reveal valve inconsistencies before complaints about underfilled product arise. On a machining or stamping process, dimensional trends can highlight tool wear long before parts fall outside tolerance.
Control Limits, Control Charts, and the Essentials of Reading SPC Signals
Start With the Center Line and Control Limits
To build confidence in understanding SPC control charts, start with one machining example: a turned shaft with a target diameter of 25.000 mm. The center line on the chart represents the process average, while the upper and lower control limits show the expected range of routine process variation. If the process is stable, most subgroup averages or individual readings will stay within those limits and move in a reasonably random pattern.
Control limits are often confused with specification limits, but they answer different questions. Control limits describe what the process is actually doing over time, based on real production data, while specification limits define what the customer or drawing will accept. A shaft diameter can remain within spec and still be statistically unstable, which is why manufacturers use SPC to detect drift before it creates scrap, rework, or customer risk.
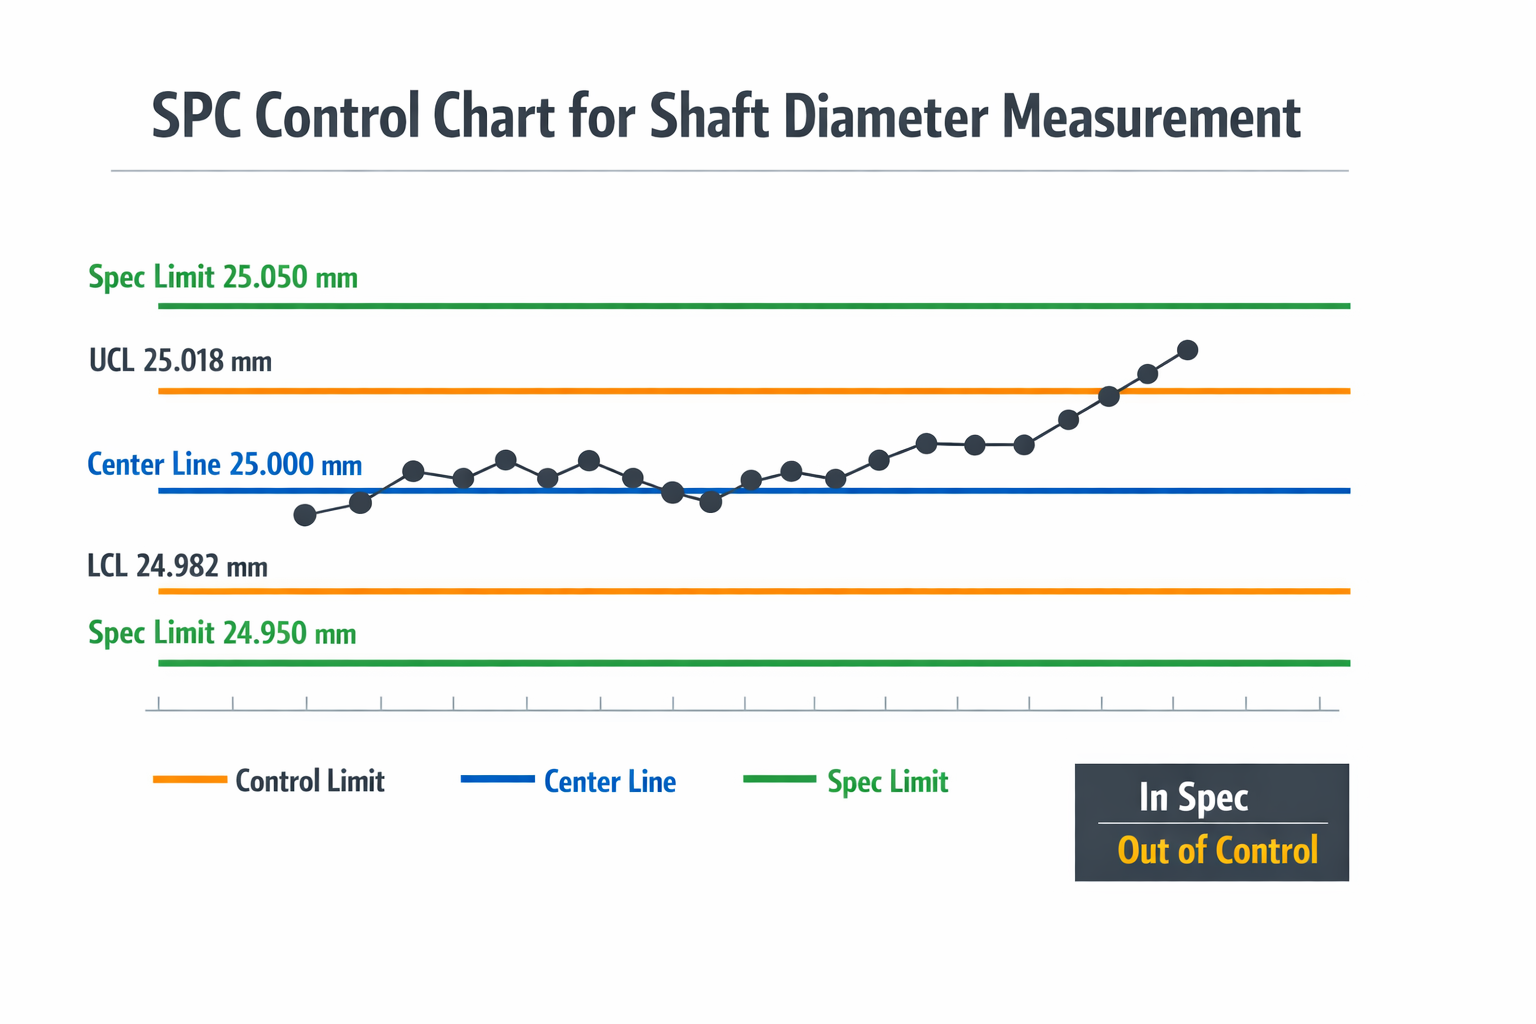
In our shaft example, assume the drawing tolerance is 24.950 to 25.050 mm, but the control limits calculated from the live process are tighter, at 24.982 to 25.018 mm. That does not mean the control chart is “stricter” than the print; it means the process normally performs inside a narrower band. When the chart shows an abnormal signal, the team should investigate process behavior first, not wait until a measurement crosses the specification line.
Know Which Chart Fits the Data
The main chart choice depends on whether you are tracking variable data or attribute data. For measured dimensions like shaft diameter, teams usually use an X-bar and R chart for subgroup data or an Individuals and Moving Range chart when measurements are taken one at a time. For attribute data such as defect counts or pass/fail results, common options include p charts, np charts, c charts, and u charts.
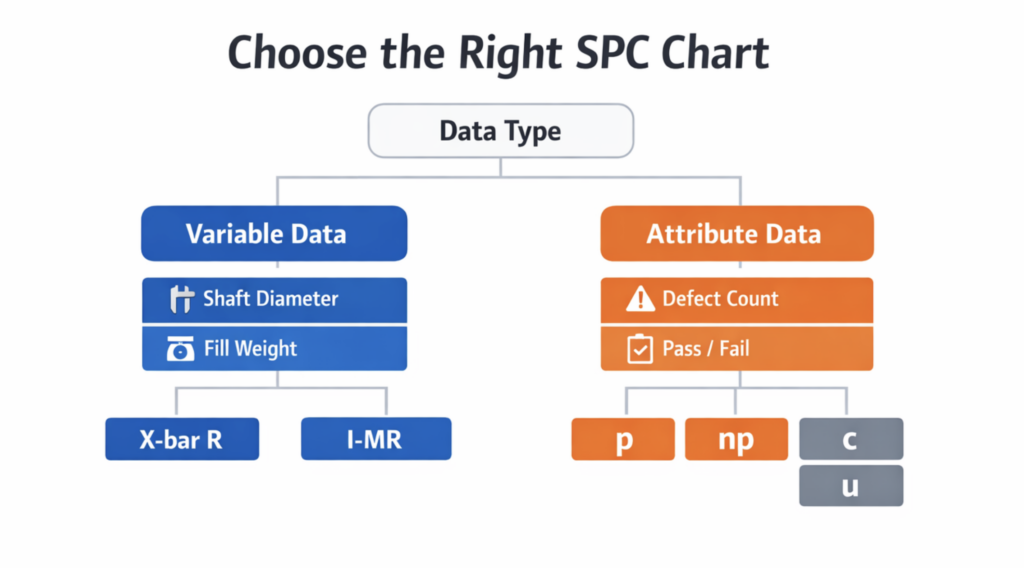
For this machining line, imagine the operator measures five shafts every hour, so an X-bar and R chart is the practical choice. The X-bar chart shows whether the subgroup average is shifting, while the R chart shows whether within-sample variation is expanding. Reading both together matters because an average can look acceptable even when process spread is becoming unstable.
Read the Pattern, Not Just Single Points
Many teams look only for points outside the control limits, but SPC signals are broader than that. A chart can warn you through trends, such as six or seven points steadily moving upward, or runs, such as eight points in a row staying above the center line. These patterns suggest the process has changed, even if every point still falls within the upper and lower limits.
In the shaft example, suppose the last seven subgroup averages climb from 24.996 mm to 25.012 mm. None of those points is out of control yet, but the upward trend suggests tool wear, thermal growth, or a machine offset issue. This is how SPC helps reduce defects in manufacturing: it gives the team time to act while parts are still largely conforming.
Distinguish Signal From Noise
A good rule for how to use statistical process control is to avoid reacting to every small movement. If one subgroup average drops slightly below the previous one, that is usually normal fluctuation, not a reason to adjust the machine. Unnecessary adjustments, often called tampering, can increase variation and make a capable process worse.
Now imagine one subgroup average suddenly reaches 25.022 mm, above the upper control limit, while the range chart also spikes. That combination is a stronger out-of-control signal than a minor random shift around the center line. At this stage, the quality engineer or production supervisor should treat the chart as evidence of a specific process change and move to the reaction plan, which the next section will cover.
How to Use Statistical Process Control on the Shop Floor
Start With the Characteristic That Matters Most
On the shop floor, SPC works best when you apply it to a small number of characteristics that directly affect fit, function, safety, or downstream yield. A production manager should not try to chart every dimension or defect code at once, because that usually creates noise and weak follow-up. Start with a critical process characteristic such as torque on an automotive assembly station, solder paste height in electronics, or fill weight in packaged goods. The goal is to focus SPC where a process shift would create real business risk, not just more data.
A practical selection method is to combine three inputs: customer requirements, process capability history, and defect cost. If a dimension is tightly toleranced but already highly capable, it may need less attention than a feature that causes frequent rework or complaints. In automotive assembly, for example, bolt torque on a suspension component is a stronger SPC candidate than a cosmetic trim gap because the consequence of drift is much higher. This is where SPC starts to reduce defects in manufacturing: by watching the variables that actually drive escapes, scrap, or line stoppage.
Define Sampling Frequency Around Process Risk
Once you choose the characteristic, decide how often to sample based on process stability, cycle time, and reaction speed. High-volume processes with known drift patterns often need shorter intervals, while slower and more stable operations may only need hourly or per-lot checks. The mistake many teams make is setting frequency by habit instead of by risk. If the process can produce hundreds of bad units before the next check, the plan is too slow.
In an SMT line, a quality engineer may sample solder joint defects every 30 minutes during startup, then move to hourly checks once the printer and reflow oven are stable. On a three-shift machining line, the first piece after shift change, tool change, or maintenance event often deserves extra sampling because those moments carry higher variation risk. Good SPC practice links timing to process behavior, not to a fixed template copied across the plant. That makes understanding SPC control charts more useful, because the data reflects real process conditions.
Build a Clear SPC Workflow and Reaction Plan
A workable shop-floor SPC routine usually follows five steps: measure, record, review, decide, and react. The operator or inspector measures the sample, records the result immediately, checks the chart for signals, and follows a predefined response if the process shows an abnormal pattern. Quality engineers review exceptions, confirm root cause direction, and decide whether containment, adjustment, or escalation is needed. Without this chain, even well-designed charts become passive records instead of control tools.
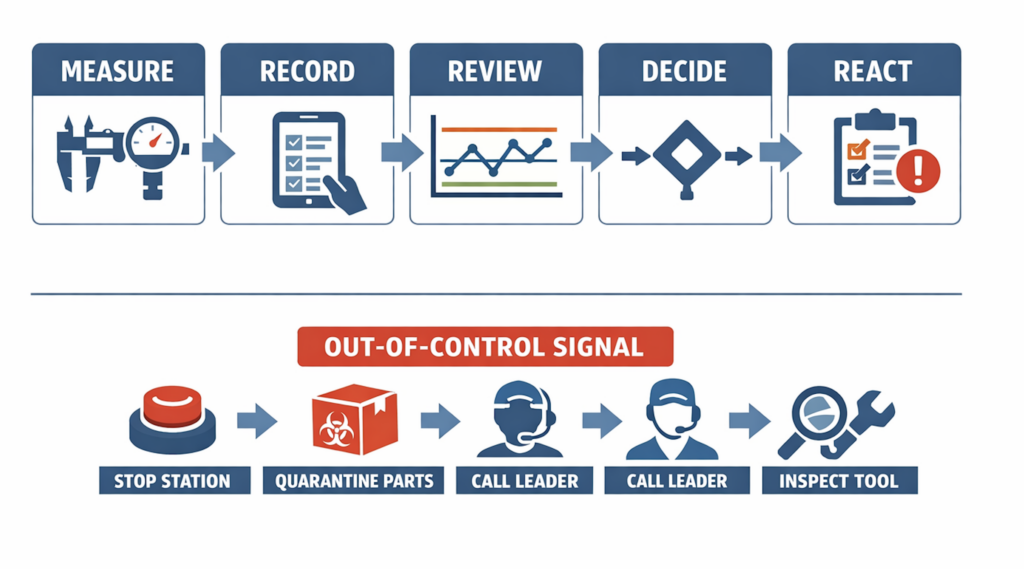
The reaction plan should be specific enough that different shifts respond the same way. For example, if a control signal appears on a press-fit force chart, the operator may stop the station, quarantine parts produced since the last in-control check, call the line leader, and trigger tool inspection. If the only instruction says “inform quality,” response time will vary, and defects can multiply. Strong SPC depends as much on disciplined action as on data collection.
Assign Ownership by Role, Not by Department
SPC fails when everyone assumes someone else is watching the chart. Operators should own measurement and first-line response, supervisors should own production decisions and manpower coordination, and quality engineers should own rule setting, escalation criteria, and chart review discipline. This division keeps reaction fast without turning every signal into a quality department bottleneck. It also helps multi-shift teams maintain consistency when staffing changes.
In practice, ownership should be visible at the process level. An electronics plant may define that operators record AOI defect counts, shift leaders review trend breaks at the hourly meeting, and the process engineer investigates repeat solder bridge signals within the same shift. That structure turns how to use statistical process control into a daily routine rather than a quality initiative that only appears during audits.
From Spreadsheets to Real-Time SPC Workflows with Jodoo
Where Traditional SPC Execution Slows Down
Many manufacturers understand SPC in principle but still run it through paper check sheets, offline Excel files, and supervisor follow-up by phone or chat. The problem is not the chart itself; it is the delay between measurement, interpretation, and action. When data sits at the machine for two hours or in a spreadsheet until the end of the shift, the process may already have produced a full batch of suspect parts. That gap weakens how SPC helps reduce defects in manufacturing.
Consider a CNC machining line tracking a critical shaft diameter every 30 minutes. The operator records readings manually, then a line leader enters them into a spreadsheet later in the shift. By the time the quality engineer notices a run toward the upper control limit, three machines have already used the same worn tool offset. In practice, this means teams know how to use statistical process control, but their workflow prevents timely response.
How Jodoo Turns SPC Data Into Live Process Signals
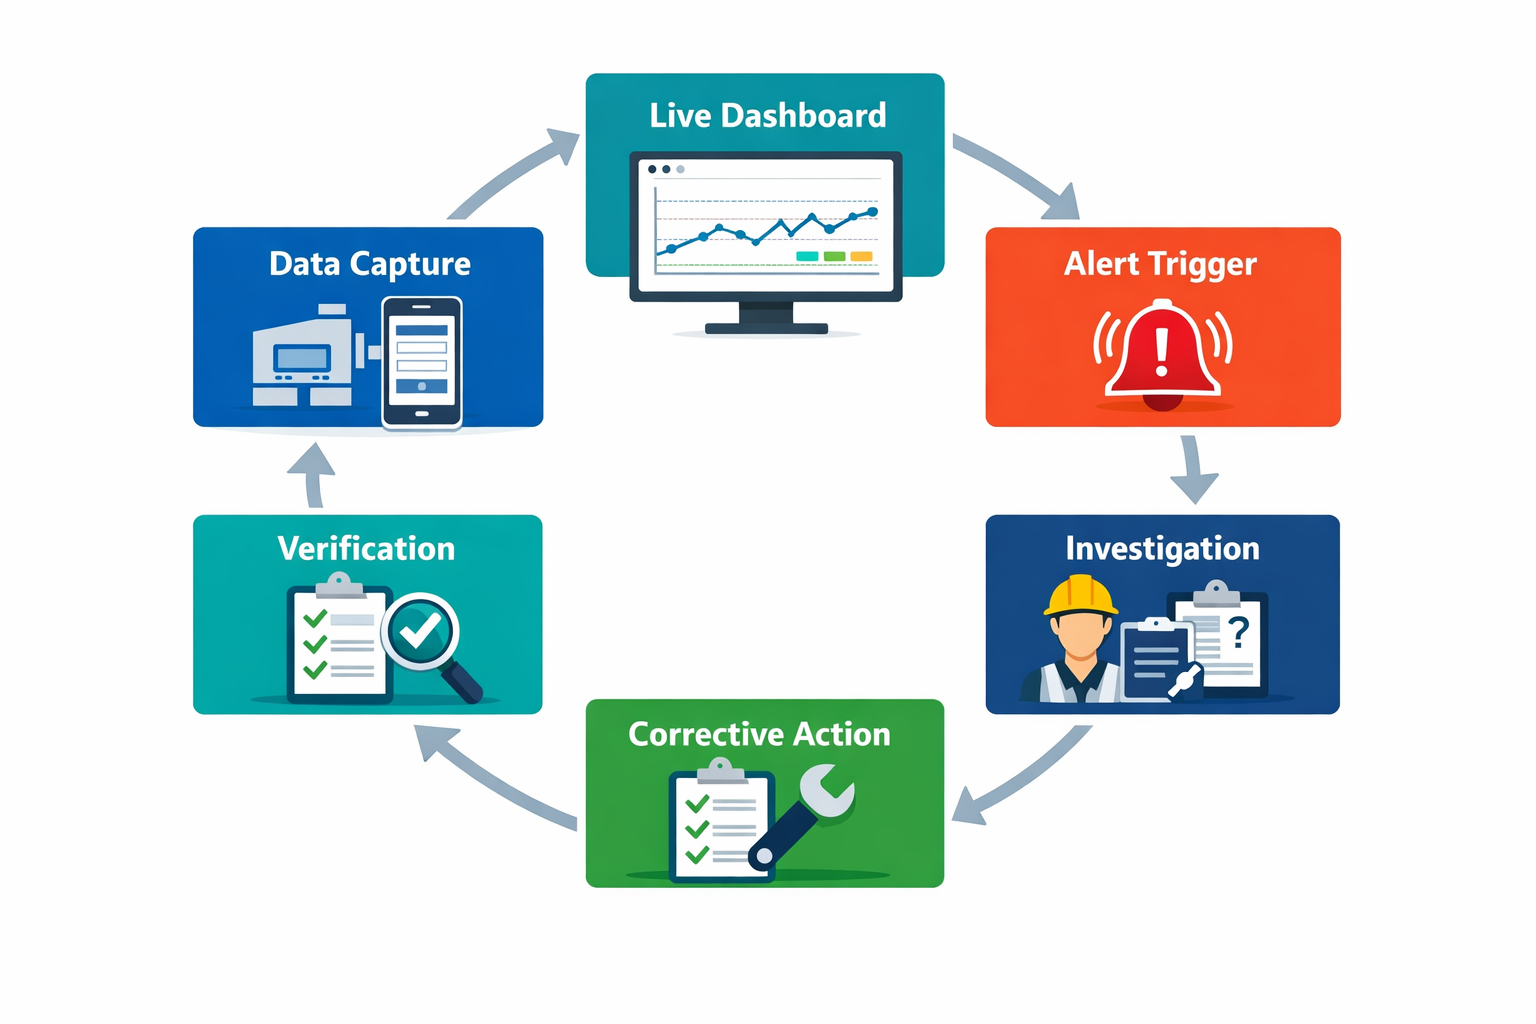
Jodoo can be configured so the operator enters each shaft-diameter reading directly into a mobile form at the machine. The form can include part number, machine ID, cavity or spindle number, shift, operator name, tool life count, and the measured value, with validation rules to reduce entry errors. If measurements come from a digital gauge, PLC, or MES, the same data can also be pushed into Jodoo through API-based integration instead of manual input. That gives the team one structured source of data rather than multiple disconnected files.
Once the reading is submitted, Jodoo can update a real-time dashboard that shows the latest subgroup values, trend direction, and exception status by machine or production line. For a production manager, this makes understanding SPC control charts far easier because the signal is visible while the process is still running, not after a spreadsheet is cleaned up. Engineers can filter by product family, shift, or machine to see whether the issue is isolated or spreading.
Building a Closed-Loop Response Workflow
The real gain comes when SPC is connected to action, not just visualization. In the machining example, if a submitted reading breaches a control rule, Jodoo can automatically trigger an alert to the assigned quality engineer and production supervisor through in-app notifications, email, or messaging channels. The workflow can require the operator to pause the next run, attach a photo of the gauge reading, and select a suspected cause such as tool wear, fixture looseness, or temperature drift.
The engineer then receives a linked investigation task with the measurement history, machine details, prior similar incidents, and response deadline already attached. If tool replacement is confirmed, the workflow can route a digital approval to the shift supervisor, log the disposition for parts produced since the last accepted sample, and assign verification sampling after adjustment. Instead of relying on memory or separate emails, the full path from signal to containment to corrective action is documented in one system.
What a Practical Jodoo SPC Setup Looks Like
A useful setup does not need to be complex. Most teams start with three connected pieces: a measurement form, a live dashboard, and an exception workflow. In Jodoo, that can be built as a no-code app with role-based access so operators submit data, engineers review signals, and managers see plant-level trends without editing raw records. This structure supports daily SPC execution without waiting for IT to build a custom quality module.
Over time, the same workflow can be extended to include layered approval, CAPA tracking, audit history, and links to maintenance or tool-change records. That matters because the real question is not only how to use statistical process control, but how to make the response repeatable across shifts and lines. When SPC data, alerts, and follow-up live in one workflow, manufacturers can react faster, standardize decisions, and keep variation from becoming customer-facing defects.
Conclusion: Make SPC More Predictive With a Flexible Digital System
Statistical Process Control works when teams treat variation as an operating signal, not just a quality report after the fact. For quality engineers and production managers, the goal is straightforward: understand which variation is normal, spot abnormal patterns early, and act before scrap, rework, or customer complaints increase. When control charts are read correctly and paired with clear reaction plans, SPC becomes a practical system for preventing defects rather than sorting them.
The challenge is rarely the theory alone. In many plants, SPC breaks down because data is delayed, chart reviews are inconsistent, and follow-up actions are not documented in one place. That is where a flexible digital workflow makes a difference, especially in multi-shift environments where speed and accountability matter.
Jodoo is a no-code lean manufacturing platform that helps manufacturers build SPC workflows around the way their operations actually run. You can digitize measurement capture, update dashboards in real time, trigger alerts for out-of-control conditions, and route corrective actions without a long software rollout. If you want to make SPC faster, more visible, and easier to sustain, you can start a free trial or book a demo to explore what fits your plant.