เรียกดูตามหมวดหมู่

Introduction: Why GHG Emissions Data Readiness Matters in Manufacturing
Manufacturing drives a major share of global greenhouse gas emissions, with industry accounting for roughly one-quarter of energy-related CO2 emissions worldwide, according to the IEA. For plant and sustainability teams, the pressure to understand greenhouse gas (GHG) emissions now comes from more than annual reporting. Customers, corporate leadership, auditors, and regulators increasingly want site-level visibility into where emissions-related activity happens, which data is missing, and whether numbers can be traced back to bills, meters, fuel logs, and production records.
A multi-site company may run stamping lines in one plant, boilers and chillers in another, and outsourced warehousing elsewhere, all with different utility structures, data owners, and record quality. In practice, the first problem is often not calculation. It is knowing which sources exist, which sites belong in the inventory, and whether the underlying operational data is complete enough to support consistent reporting later.
This article focuses on explaining common emissions sources in manufacturing and how to prepare an emissions inventory for reliable data collection before quantification begins.
What GHG Emissions Mean in Manufacturing
Greenhouse Gas Emissions in a Manufacturing Context
ในภาคการผลิต, greenhouse gas emissions are the gases released to the atmosphere from energy use, fuel combustion, chemical reactions, refrigerant leakage, and other operating activities linked to the plant. For most factory teams, the practical question is where emissions arise in day-to-day operations and what records show that those activities happened. Common gases include carbon dioxide, methane, nitrous oxide, and certain fluorinated gases, each tied to different equipment, materials, or processes. An emissions inventory brings those sources into one structured view so the business can later quantify, review, and report them consistently.
The term GHG emissions is broader than stack smoke or utility consumption alone. A food processing site may generate emissions from boiler fuel, wastewater handling, and refrigerant top-ups, while an electronics facility may have lower direct combustion but higher electricity dependence and fluorinated gas risks in cooling or specialty processes. This is why manufacturing teams need a source-based understanding rather than a narrow energy-only lens. The inventory starts by identifying what operational activity could create emissions, even before calculation begins.
Why Manufacturers Use a CO2e Context
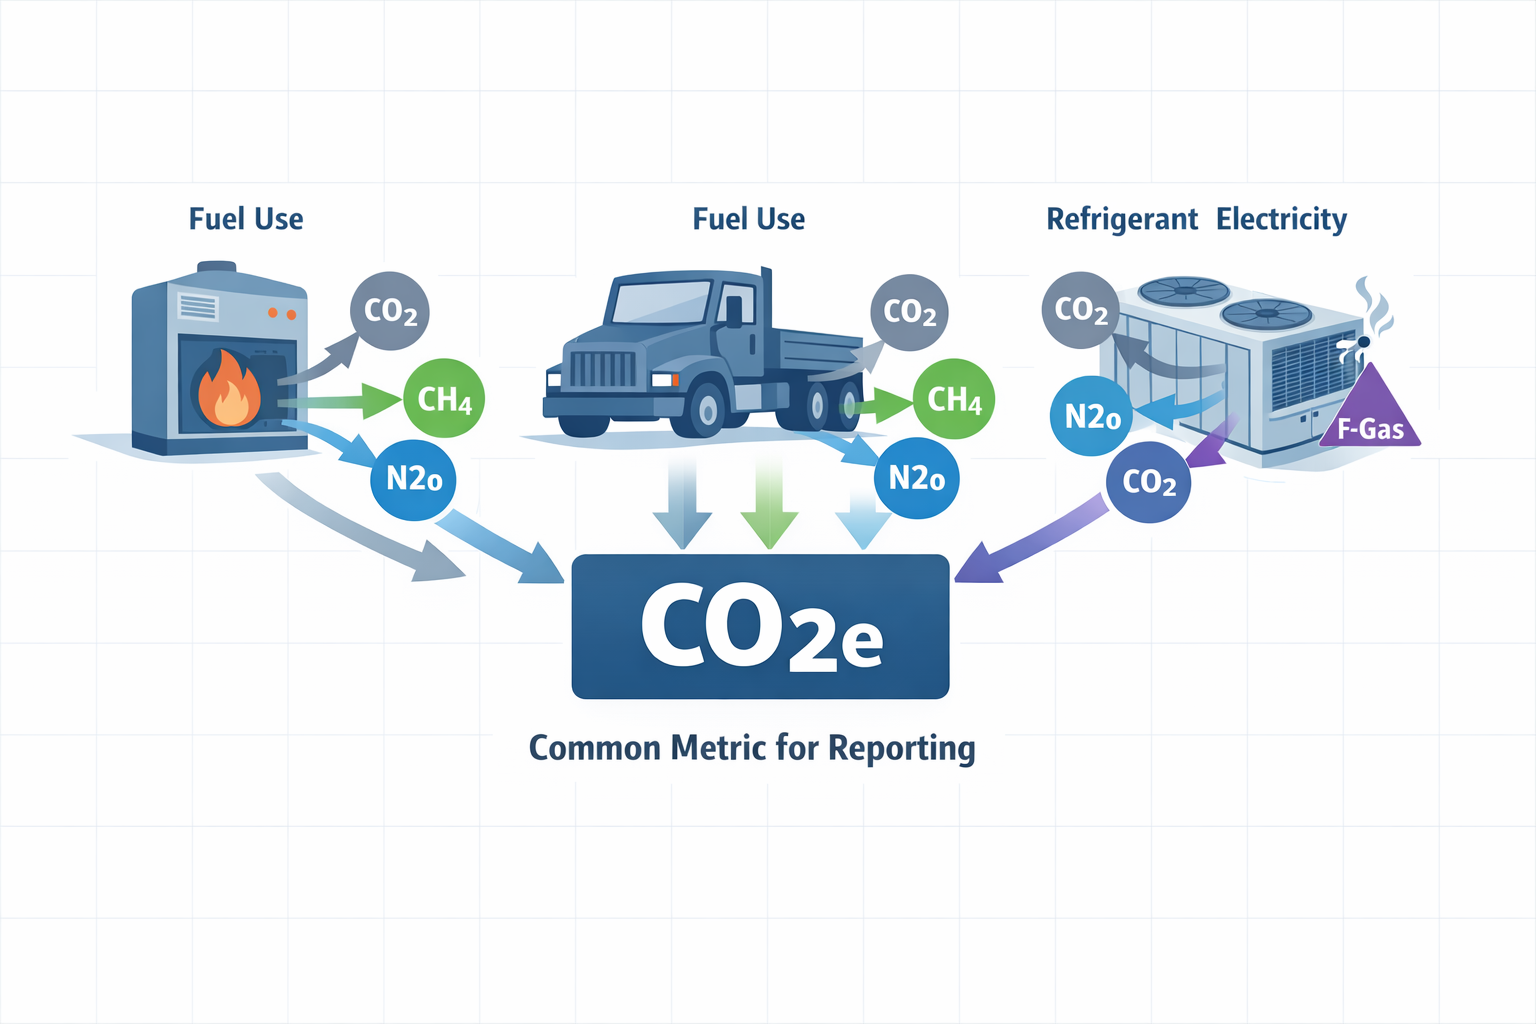
Different greenhouse gases do not affect the atmosphere in the same way or at the same intensity. If a company tracked only kilograms of each gas separately, a plant manager would struggle to compare a diesel-consuming warehouse fleet, a gas-fired oven line, and a refrigerant leak from HVAC equipment in one decision-making view. Expressing emissions in a CO2e context solves that problem by translating unlike gases into a common comparison unit. That gives sustainability, อีเอชเอส, and operations teams one usable number framework for prioritization, trend tracking, and consolidated reporting across sites. The CO2e context is therefore a reporting and management convention, not a description of the raw source record itself.
Source Data, Activity Data, and Quantification Inputs
A common mistake in emissions programs is mixing up what happened physically with what will later be used to calculate emissions. Physical source data identifies the emitting source or asset, such as Boiler 2, Line 4 curing oven, or forklift fleet A. Emissions-relevant activity data records what that source consumed, produced, or released, such as 12,000 cubic meters of natural gas, 4,500 liters of diesel, or 18 kilograms of refrigerant added during maintenance. These records are the operational backbone of an emissions inventory.
Later-stage quantification inputs are different again. They include the technical references, assumptions, and conversion logic used to translate activity data into emissions values, such as emission factors, gas-specific treatment, and methodological rules. A cement plant, for example, may track tonnes of clinker produced as activity data relevant to industrial process emissions, but the conversion into reportable emissions comes afterward. Keeping these layers separate helps manufacturing teams improve data quality without getting stuck in accounting debates too early.
For plant and EHS teams, good readiness data is specific, traceable, and consistent in units of measure. A meter reading, supplier invoice, maintenance log, batch record, or fuel issue sheet is often more valuable at this stage than a spreadsheet total with no source evidence behind it. If one textile mill reports LPG in kilograms and another in cylinders without standard definitions, the data may be operationally real but not yet ready for consistent inventory use. Early discipline matters because weak source records create rework later, even when the quantification method is sound.
Common GHG Emissions Sources Across Multi-Site Manufacturing Operations
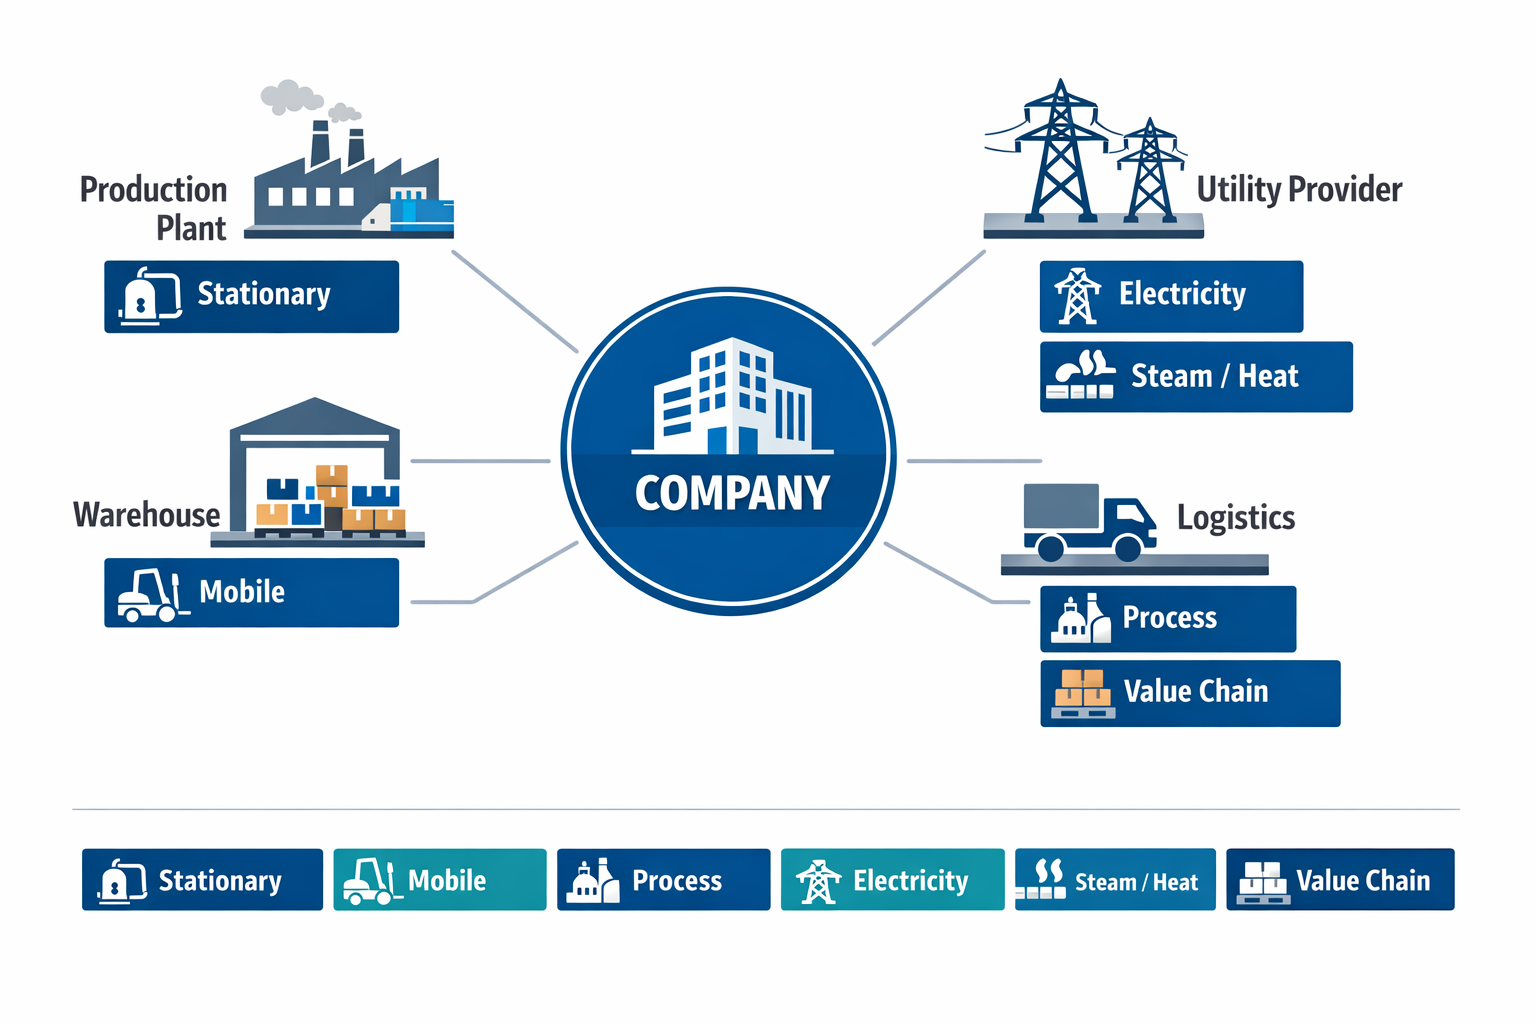
Before any plant starts collecting data, the central team needs a practical source register for its emissions inventory. In most manufacturing groups, that register spans on-site fuel use, company-controlled transport, process-related releases, imported energy, and selected upstream or downstream activities that matter to the business. The exact mix varies by site, so a ceramics plant, an electronics assembly site, and a cold-chain warehouse under the same parent company can have very different GHG emission profiles even before any calculations are done.
Stationary Combustion Sources
Stationary combustion usually includes equipment that burns fuel on-site to support production or facility operations. Common examples are boilers, furnaces, ovens, kilns, thermal oxidizers, and standby generators using natural gas, diesel, LPG, fuel oil, or coal, depending on local infrastructure. A food processing site may rely heavily on gas boilers for hot water and steam, while a metalworking plant may have several diesel backup units because of grid instability. These assets are often easy to recognize physically, but harder to capture completely when temporary units or older equipment are not listed in one asset register.
Mobile Combustion Sources
Mobile combustion covers fuel burned in vehicles and moving equipment that the company owns or controls. In manufacturing, this may include forklifts, yard trucks, shuttle vehicles, internal logistics fleets, and sometimes marine or rail assets at large industrial sites. A regional packaging manufacturer, for example, may have one site with only electric forklifts and another site with diesel yard tractors moving finished pallets to a nearby warehouse. That difference changes the source list even when both plants produce similar products.
Industrial Process Emissions
Industrial process emissions come from chemical or physical transformations in production, not just from burning fuel. These sources are especially important in sectors such as cement, lime, glass, chemicals, semiconductors, metals, and refrigeration-intensive operations where specific gases may be released during manufacturing or maintenance. A glass plant may need to identify carbonate-related releases from melting operations, while an electronics facility may track fluorinated gases used in etching or cleaning steps. For many manufacturers, this is the category most likely to be missed if the emissions inventory is built only from utility bills and fuel purchases.
Purchased Electricity
Purchased electricity is often the largest and most visible source category across multi-site operations, especially in discrete manufacturing. Assembly plants, machining centers, clean rooms, compressed air systems, and HVAC loads can all make electricity consumption a major part of GHG emissions. An electronics assembly site may have limited direct fuel use but very high power demand from SMT lines, test equipment, and air handling systems. By contrast, a heavy process plant may use less purchased electricity relative to fuel-fired thermal loads.
Purchased Steam, Heat, or Cooling
Some sites do not generate all thermal energy on-site and instead buy steam, district heat, or chilled water from utilities, industrial parks, or adjacent plants. This is common in industrial estates across Southeast Asia, where shared infrastructure supports multiple tenants with different process needs. A pharmaceutical site may purchase clean steam from a central utility provider, while a cold-storage facility may buy district cooling rather than operate its own chiller plant. These imported energy streams need to be listed clearly because they sit outside direct fuel combustion but still affect the inventory boundary.
Set Inventory Boundaries Before Collecting Emissions Data
Before you launch any emissions inventory workflow, you need a clear answer to one question: what exactly is in scope for this company and reporting period? In manufacturing, that decision is rarely simple because operations often span owned plants, leased warehouses, tolling arrangements, shared utility systems, and temporary shutdown or startup conditions. If boundaries are vague, the data collection process will produce gaps, duplicate entries, and debates that slow down greenhouse gas emissions reporting later.
Organizational Boundary vs. Operational Boundary
Organizational boundaries define which legal entities, sites, or business units belong in the inventory. Operational boundaries define which emissions-generating activities within those entities must be tracked, such as fuel combustion, purchased electricity, industrial process emissions, refrigerant losses, or selected upstream and downstream activities. In practice, the first decides where you collect from, and the second decides อะไร you collect within those locations.
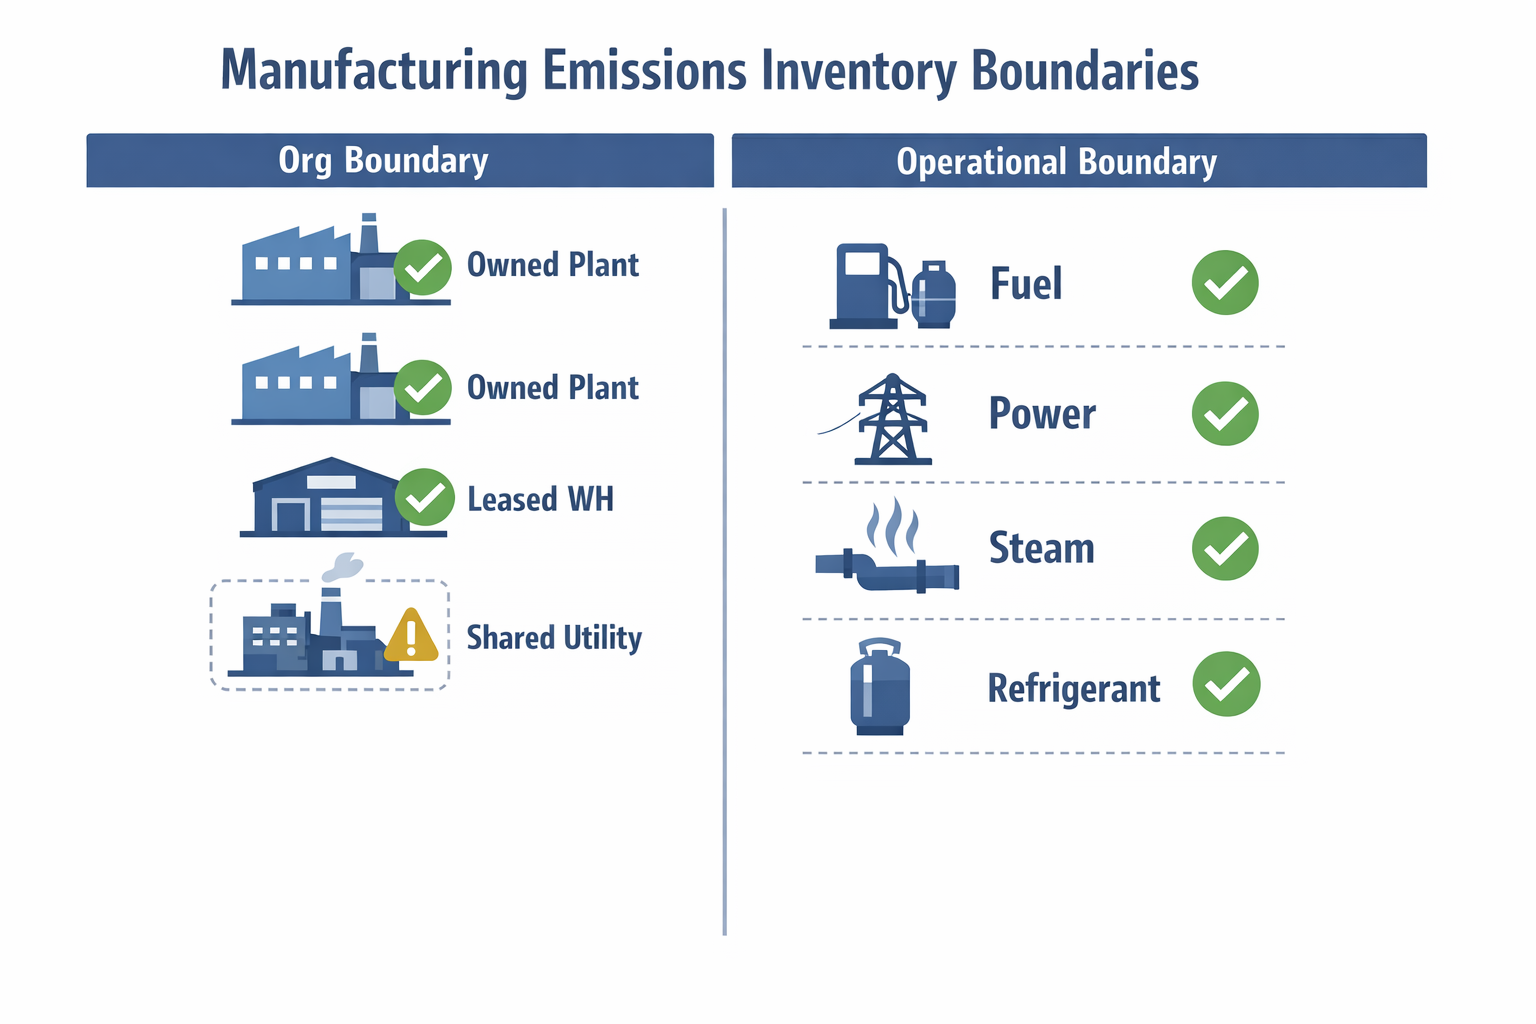
Consider a regional manufacturer with two owned plants in Thailand and Vietnam, one leased warehouse in Malaysia, and a shared utility plant inside an industrial estate. The sustainability team may decide that all majority-controlled entities fall inside the organizational boundary for this year’s emissions inventory. It then has to determine whether warehouse electricity, backup diesel use, and the share of steam from the estate utility system are operationally relevant enough to include.
Use One Decision Logic Across All Sites
A common mistake is letting each site interpret the boundary differently. One plant may include forklift LPG; another may exclude it as immaterial, and a warehouse team may assume leased operations sit outside reporting. To avoid that, corporate teams should publish one boundary rule set covering ownership, control, lease arrangements, utilities, contractor-operated assets, and abnormal operating scenarios such as trial runs or extended maintenance shutdowns.
In the running example, the manufacturer sets one rule for all sites: owned production plants are included, leased logistics space is included when the company controls utility purchasing or equipment operation, and shared central utilities are included only to the extent the company receives and can document allocated consumption. This does not finish classification, but it gives each site a consistent basis for identifying the greenhouse gas emissions data that belong in the reporting workflow. That consistency is especially important when source data will later be translated into a CO2e context across unlike activities.
Decide How to Treat Leased and Shared Operations
Leased and shared arrangements often create the most confusion. A leased warehouse may have no direct fuel use but still consume purchased electricity under the company’s account, while a plant inside an industrial park may receive chilled water, steam, or compressed air from a central provider. The point is not to solve every accounting nuance upfront, but to document whether these activities are included, excluded, or pending further review under current GHG Protocol guidance.
For the manufacturer in this example, the Malaysia warehouse is included because utility invoices and equipment control sit with the company. The shared utility system is treated as in scope where monthly allocation statements are available, while undocumented common-area loads are flagged for separate review rather than estimated informally. This approach keeps the boundary decision disciplined without drifting into premature calculation assumptions.
Apply the Scope 1, Scope 2, and Scope 3 Frame Carefully
Once boundaries are set, the Scope 1, Scope 2, and Scope 3 structure becomes much easier to use. At a high level, Scope 1 covers direct emissions from owned or controlled sources, Scope 2 covers indirect emissions from purchased energy, and Scope 3 covers other value-chain activities.
In the example company, natural gas at the two plants likely falls into Scope 1, purchased electricity for the plants and the leased warehouse into Scope 2, and selected outsourced logistics or purchased materials into Scope 3. Some industrial process emissions may also sit within direct plant operations, depending on the production process. For detailed treatment, teams should refer to the latest GHG Protocol guidance, then carry those decisions into the source-data workflow built in the next step.
Build a Source-Data Workflow That Makes GHG Emissions Collection Reliable
Define the Workflow Before You Collect Anything
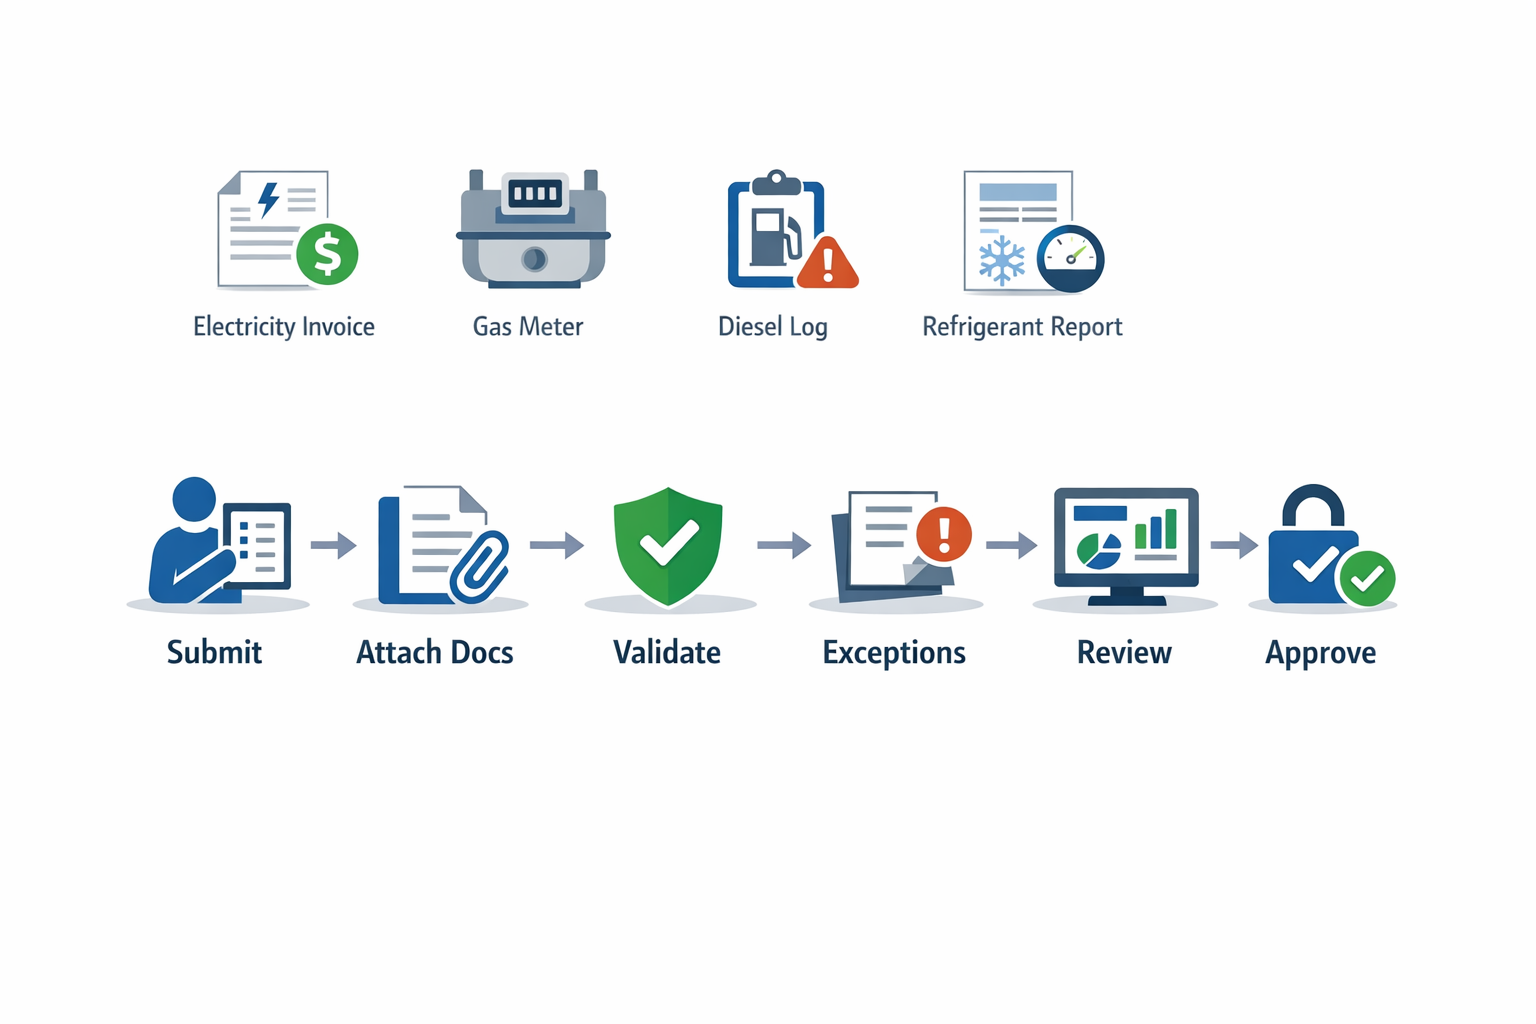
Once boundaries and source categories are set, the next step is operational control. A usable GHG emissions workflow tells each site what to submit, in what unit, how often, and with what evidence. For a manufacturer with three plants, one warehouse, and mixed utilities, that usually means monthly electricity invoices, natural gas meter readings, diesel tank logs, refrigerant records, and any site-specific industrial process emissions inputs that need separate tracking.
The workflow should move in a fixed sequence: plant owner submission, document attachment, automatic field validation, exception routing, corporate review, and locked approval. That sequence matters because most emissions inventory problems come from missing units, inconsistent source names, late files, or untraceable edits rather than from calculation logic itself.
Assign Owners by Source
A common mistake is assigning one environmental coordinator to “handle emissions data” for an entire plant. In practice, data quality improves when ownership follows the source: facilities for electricity and gas, logistics for fuel consumed by site vehicles, maintenance for refrigerants, and production or process engineering for process-related records. Corporate sustainability then acts as a reviewer, not a primary data collector.
In the running example, Plant A’s facilities manager submits grid electricity and boiler gas, Plant B’s maintenance lead enters chiller refrigerant top-ups, and Plant C’s production engineer reports kiln throughput data tied to process emissions. The warehouse team only submits purchased electricity because it has no combustion assets on-site. This source-based design reduces guesswork and shortens review time because each owner works from records they already manage.
Standardize Fields, Units, and Submission Cadence
Every source form should require the same minimum structure across sites: source category, asset or meter ID, reporting period, quantity, unit, supplier or document reference, site name, and responsible owner. If you allow one plant to submit diesel in liters, another in gallons, and another as total cost only, your emissions inventory becomes a manual cleanup exercise. Standard units should be defined centrally, with conversion rules handled only where necessary and clearly documented.
Cadence also needs to match the source. Utility invoices are often monthly, fuel withdrawals may be weekly and rolled up monthly, and some industrial process emissions inputs may follow batch or campaign cycles before monthly consolidation. The key is to design one review calendar that accommodates these rhythms without forcing plants into ad hoc reporting.
Require Evidence and Build Validation Into Submission
Reliable data collection depends on evidence, not trust alone. Each submission should include the relevant invoice, meter photo, fuel log, service report, or อีอาร์พี extract so reviewers can confirm period coverage and source legitimacy. If the source is estimated, the workflow should require an estimate flag, reason code, and expected correction date.
Validation checks should happen before corporate review. Useful controls include mandatory attachments, unit restrictions, duplicate invoice detection, meter-to-meter continuity checks, and variance alerts when usage changes beyond a defined threshold from the prior month. These rules do not calculate greenhouse gas emissions, but they prevent poor-quality inputs from entering the inventory.
Route Exceptions, Approvals, and Change History
When a Plant B electricity bill is missing, the workflow should not leave the record half-complete in the email. It should route the submission into an exception queue with status labels such as missing evidence, unit mismatch, abnormal variance, or estimated data pending replacement. That makes unresolved items visible before reporting deadlines compress the review cycle.
After validation, corporate sustainability or EHS reviewers approve, return, or request clarification, and every action should be timestamped. Change history matters because emissions data is often revised after corrected invoices arrive or leased-area allocations are updated. A controlled system such as Jodoo can standardize these submissions with required fields, approval paths, attachments, exception routing, and audit trails across sites without turning the workflow into a spreadsheet chase.
Conclusion: Turn Emissions Inventory Readiness Into a Scalable Workflow With Jodoo
เชื่อถือได้ GHG emissions management in manufacturing starts well before calculation. First, you need a clear map of emissions sources across plants, utilities, vehicles, and selected value-chain activities. Then you need practical boundary decisions, defined data owners, and a controlled collection process that makes submissions consistent, reviewable, and audit-ready.
For multi-site manufacturers, this is often the real bottleneck. Data sits in utility invoices, fuel logs, maintenance records, and local spreadsheets, with different units, naming rules, and approval practices by site. That is why emissions readiness is less about carbon formulas at the start and more about workflow discipline, traceability, and operational standardization.
นี่คือที่นี่ Jodoo, a no-code lean manufacturing platform, can help. Manufacturing teams can use Jodoo to build standardized forms, approval workflows, exception handling, document capture, and cross-site dashboards for greenhouse gas emissions data collection.
If you want to standardize multi-site emissions data workflows faster, you can เริ่มทดลองใช้งานฟรี หรือ จองการสาธิต to evaluate Jodoo.