Introduction: Why the Ishikawa Diagram Matters in Manufacturing Root Cause Analysis
A small number of chronic quality issues often drive a disproportionate share of factory losses. In many plants, scrap, rework, and repeat nonconformances consume 5% to 30% of total production cost, especially when teams fix symptoms without proving the real cause. That is why the Ishikawa diagram matters: it gives cross-functional teams a simple, visual way to organize possible causes before they jump into corrective action.
Also known as a sơ đồ xương cá hoặc cause-and-effect diagram, the Ishikawa method helps manufacturers investigate problems such as recurring weld defects, dimensional variation, solder failures, contamination, and line stoppages. Instead of relying on assumptions or the loudest opinion in the room, it structures discussion around the factors that may actually be driving the defect.
This guide is written for quality managers, lean leaders, production managers, and process engineers who need a more disciplined way to handle root cause analysis on the shop floor. We will break down the 6M framework, walk through a practical manufacturing example step by step, and show how teams can connect fishbone analysis to corrective action workflows so findings do not stay stuck on a whiteboard.
What an Ishikawa Diagram Is and When to Use It
The Basic Anatomy of an Ishikawa Diagram
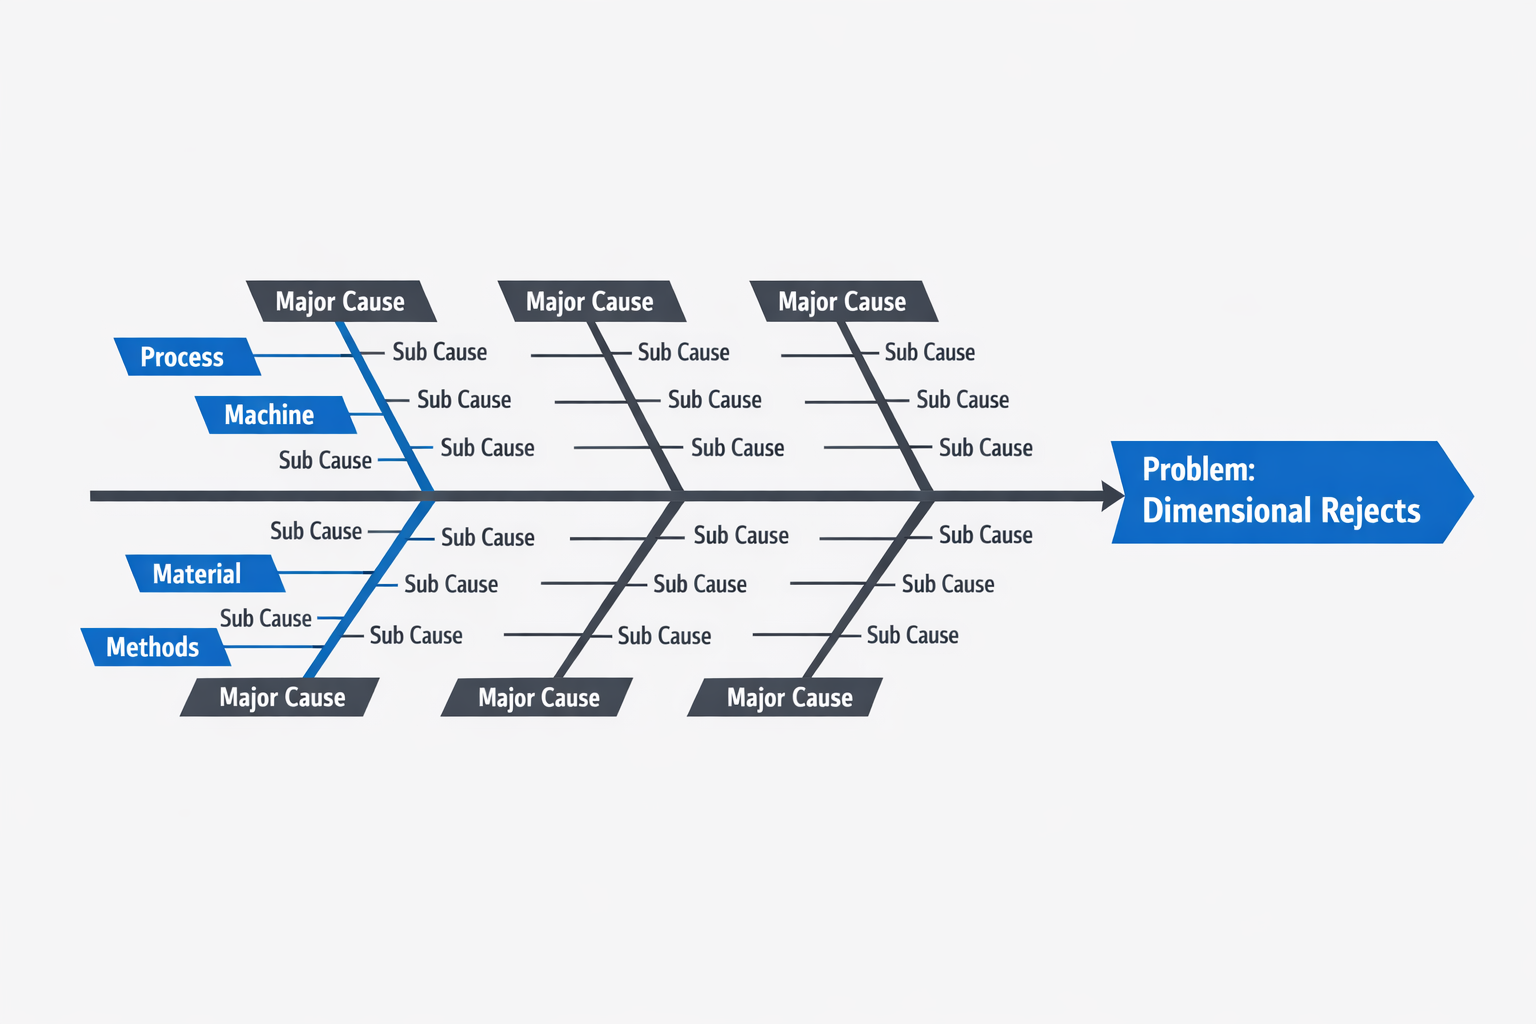
MỘT Ishikawa diagram is a visual root cause analysis tool that helps teams organize possible causes behind a specific manufacturing problem. The problem statement sits at the “head” of the fish, usually written as a measurable issue. A horizontal line forms the spine, and major cause categories branch off it. Smaller branches then capture sub-causes, suspected contributing factors, and details gathered during the investigation.
This structure matters because it forces the team to separate the effect from the possible causes instead of mixing symptoms, opinions, and solutions in the same discussion. In a good fishbone diagram, each branch answers a cause-focused question: what in the process, equipment, material, or control system could realistically create the defect? That makes the cause-and-effect diagram more disciplined than a free-form brainstorming session and easier to review later during audits or corrective action follow-up.
When It Works Best in Manufacturing
The fishbone method is most useful when a problem is recurring, cross-functional, and not explained by one obvious failure point. In manufacturing defect analysis, it often includes issues like repeat burrs in machining, unstable torque results in assembly, or intermittent label misprints in packaging. These problems usually involve several possible causes, so the team needs a structured way to map them before testing anything.
It is especially effective when you already have some baseline evidence, such as defect trends, machine logs, shift records, scrap data, or inspection results. For example, if a plastics plant sees short-shot defects rising only on one mold family during the night shift, the Ishikawa diagram helps the team group likely causes before they start checking settings, resin condition, operator practice, and cooling stability. That makes the investigation broader than guesswork, but still focused enough to act on.
When to Pair It With Other Problem-Solving Tools
A fishbone diagram is strongest when used with other quality tools rather than by itself. Pareto analysis helps you decide which defect or failure mode deserves attention first, especially when one line is generating many different nonconformances. Once the priority issue is clear, the Ishikawa diagram helps the team map the possible causes behind that specific problem.
The 5 Whys method is useful after the fishbone has surfaced a likely cause branch that needs deeper drilling. For instance, a branch may identify tool wear as a possible cause of oversize holes, but 5 Whys can help trace why tool wear was not detected earlier, such as missing replacement triggers or poor maintenance checks. In practice, many plants use Pareto to prioritize, a sơ đồ xương cá to structure possibilities, and 5 câu hỏi "Tại sao?" to verify the most credible path to root cause.
When It Becomes Less Effective
The Ishikawa diagram loses value when teams treat it as a meeting exercise instead of an evidence-based investigation. If people jump straight to solutions like retraining, changing suppliers, or adjusting machine settings before confirming the actual cause, the diagram becomes a list of assumptions. That often leads to repeated defects because the plant corrects symptoms, not mechanisms.
It is also less effective when the problem statement is vague. A statement like poor quality is too broad to support a useful Ishikawa diagram example, while scratches on stainless housing after final assembly, 4.2% of output this week, give the team something concrete to investigate. The more specific the effect, the more useful the branches become.
What Good Use Looks Like on the Shop Floor
On the shop floor, a good cause-and-effect diagram is built by a cross-functional team that includes the people closest to the process. Quality may facilitate it, but maintenance, production, engineering, and sometimes the supply chain usually need to contribute different facts. That matters because a packaging defect blamed on operators may actually trace back to worn guide rails, incorrect film tension, or incoming material variation.
A useful diagram also distinguishes between possible causes, confirmed causes, and items that still need verification. That keeps the discussion honest and prevents the board from becoming cluttered with untested opinions. The next section will show how the 6M analysis framework gives this process a more complete structure for manufacturing teams.
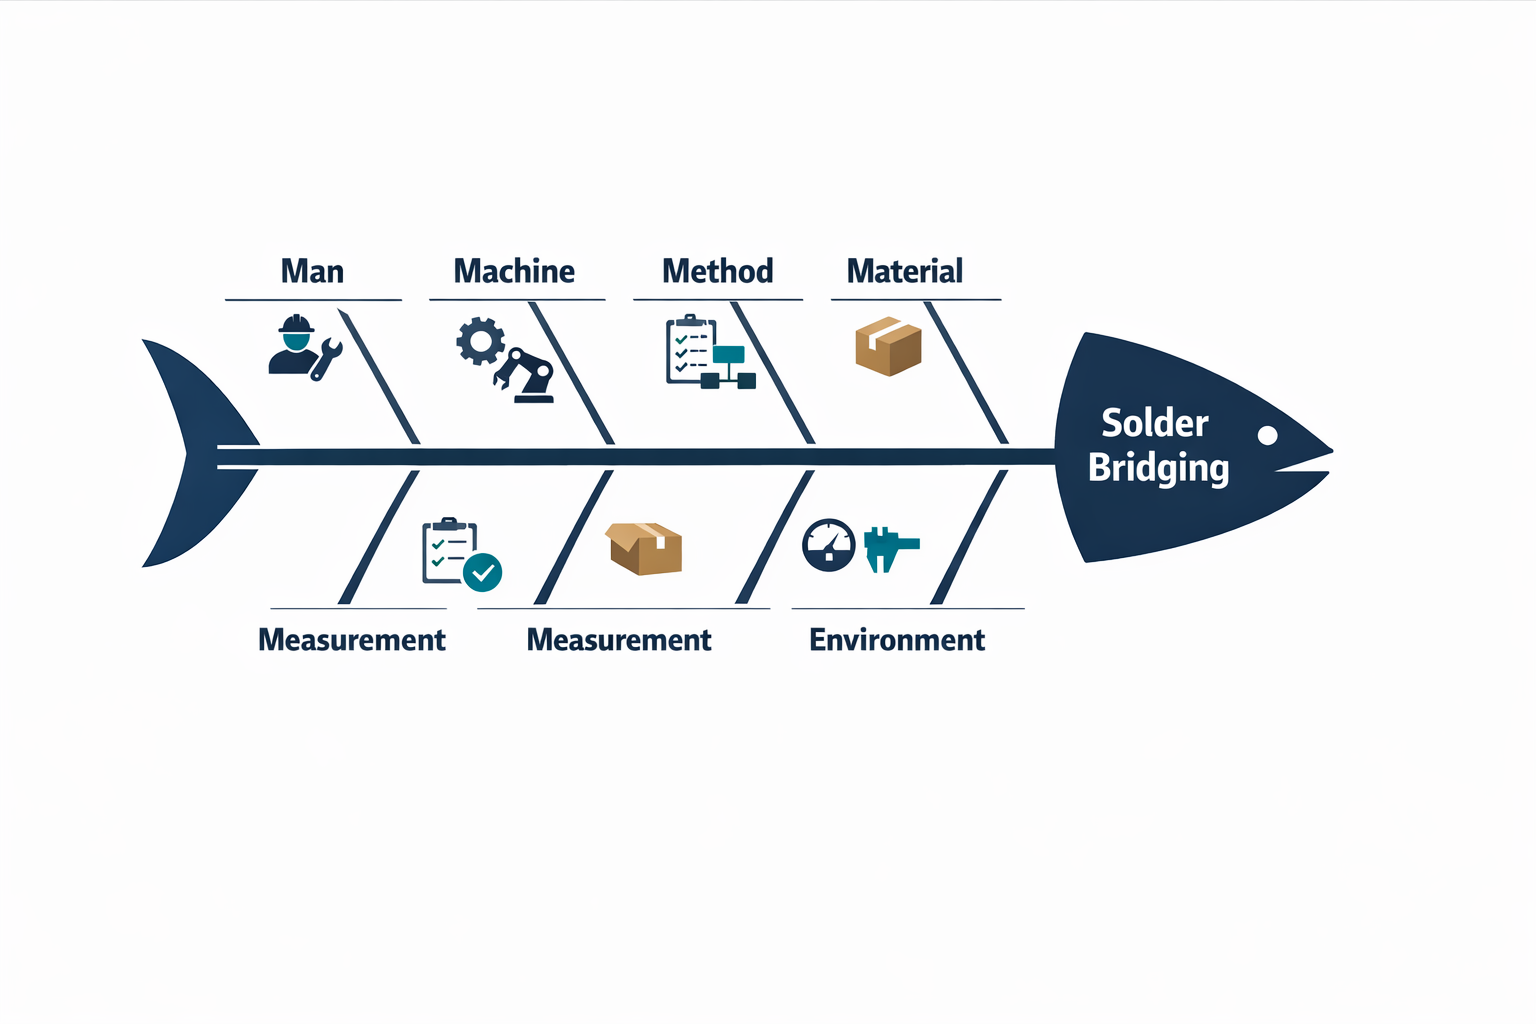
Using the 6M Analysis Framework for Manufacturing Defect Analysis
In manufacturing, the 6M analysis framework gives structure to a fishbone diagram by sorting possible causes into six standard branches: Man, Machine, Method, Material, Measurement, and Mother Nature or Environment. This matters because defect investigations often stall when teams focus too early on one suspected issue, such as operator error or equipment failure, and ignore the rest of the process. Used well, the 6M structure makes an Ishikawa diagram more complete, faster to review across departments, and more useful as a root cause analysis tool.
Man: Human Factors That Affect Process Stability
Cái Man category covers operator skill, supervision, handoff quality, and adherence to standard work. In an automotive assembly plant, intermittent torque failures may trace back to temporary operators who were cleared for the station before completing full tool verification training. In that case, the cause is not simply “operator mistake,” but a training and qualification control gap.
Human factors also include communication breakdowns between shifts. In a discrete manufacturing environment, one shift may flag recurring burr defects while the next shift continues production without adjusting tooling or containment. A cause-and-effect diagram helps teams separate frontline errors from system-level issues such as unclear escalation rules or weak shift-start review routines.
Machine: Equipment Condition, Capability, and Settings
Cái Machine branch focuses on equipment reliability, wear, calibration, and setup consistency. In electronics manufacturing, solder bridging may come from stencil wear, unstable reflow oven temperature zones, or pick-and-place alignment drift rather than from the solder paste itself. Without this branch in the Ishikawa diagram, teams can miss failure modes that only appear when equipment capability starts to degrade.
Machine-related causes are often intermittent, which makes them harder to spot without data. A stamping press in a discrete factory may produce dimensional variation only after several hundred cycles, when heat buildup changes performance. That is why machine history, preventive maintenance records, and alarm logs are critical inputs during manufacturing defect analysis.
Method: The Way the Work Is Done
Cái Method category examines process design, work sequence, inspection steps, and standard operating procedures. In an automotive welding cell, porosity defects may result from an approved method that does not define a clear pre-cleaning requirement for parts stored overnight. The equipment and material may both be acceptable, but the process method still allows contamination into production.
Method issues also appear when a process is technically documented but not practical at line speed. In electronics assembly, an inspection checkpoint may be placed too late in the process, allowing misloaded components to move through several downstream steps before detection. A good Ishikawa diagram example shows that root causes are often built into the workflow itself, not just into people or machines.
Material: Incoming Quality and Lot Variation
Cái Material branch covers raw material quality, supplier variation, storage conditions, and traceability by lot or batch. For example, an injection-molded part in a discrete manufacturing plant may show sink marks only when resin moisture exceeds specification because drying time was shortened or storage bags were left open. In that case, the defect is linked to a material condition, even though the molding machine may still be operating within standard settings.
Material causes are especially important when defects appear suddenly after a supplier change or a new batch release. In PCB assembly, one solder paste lot may have different viscosity behavior within the acceptable range, but still create print instability under the same setup. The 6M analysis approach helps teams record those possibilities early instead of treating all lots as equivalent.
Measurement: Data Accuracy and Inspection Reliability
Cái Measurement category asks whether the team can trust the data used to judge the defect. In automotive machining, a part may be rejected for an out-of-tolerance diameter when the real problem is gauge wear or an inconsistent measurement technique between inspectors. If the measurement system is unstable, the team can spend days solving a defect that does not exist in the process itself.
This is why measurement system analysis remains essential in serious root cause work. Studies in quality management often show that poor measurement repeatability and reproducibility can distort decision-making, especially near tolerance limits. In practice, the fishbone diagram should prompt questions about calibration status, sampling frequency, fixture design, and whether inspection criteria are interpreted the same way across shifts.
Mother Nature or Environment: Conditions Around the Process
Cái Mother Nature hoặc Environment branch captures temperature, humidity, dust, lighting, vibration, and other surrounding conditions that affect process performance. In electronics production, high humidity can affect component storage and solderability, while low humidity can increase electrostatic discharge risk. These factors are easy to overlook because they sit outside the machine and the operator, yet they can materially change defect rates.
Environmental causes are common in regional manufacturing operations where shop-floor conditions vary by season or building layout. For example, a precision assembly area located near an open loading bay may experience dimensional instability during hot and humid periods in Southeast Asia. In a 6M analysis, this category helps teams test whether the issue is truly process-internal or driven by external conditions acting on the process.
How to Build an Ishikawa Diagram Step by Step
Start With a Precise Problem Statement
Một thứ hữu ích Ishikawa diagram starts with a problem statement that is specific, measurable, and bounded by time, process, and product. In our example, the team does not write “poor solder quality.” They write: “On Line 3, solder joint bridging on PCB assembly increased from 0.8% to 3.6% over the last two weeks, concentrated at the final reflow stage on Product Family A.” That level of precision gives the fishbone diagram a clear target and prevents the discussion from drifting into unrelated issues.
A strong statement also separates the symptom from the assumed cause. If the team writes “bridging due to bad solder paste,” they have already biased the cause-and-effect diagram before evidence is reviewed. In manufacturing defect analysis, that mistake is common and expensive because it pushes people toward action before verification.
Build the Main Branches Before Brainstorming
Once the problem is defined, the team draws the main spine of the fishbone diagram and adds the major cause categories. In this solder defect case, the 6M analysis structure keeps the discussion disciplined: operator handling, stencil printer condition, reflow profile settings, solder paste condition, inspection method, and shop-floor environment all belong on the board before anyone starts listing details. This creates a complete frame for the investigation instead of letting the loudest theory dominate.
The key here is sequence. First, set the structure, then collect possible causes under each branch, and only after that discuss which ones are plausible. Teams that skip this step often produce a messy brainstorm instead of a real root cause analysis tool.
Brainstorm Possible Causes Without Filtering Too Early
With the branches in place, the cross-functional team begins adding sub-causes based on direct process knowledge. Under Machine, they might note worn stencil alignment pins and inconsistent conveyor speed; under Method, they might add an outdated setup sheet for Product Family A; under Material, they may include solder paste age, thawing time, and viscosity variation. Quality, production, maintenance, and process engineering should all contribute because each function sees a different part of the failure pattern.
At this stage, the goal is coverage, not certainty. A good Ishikawa diagram example captures what is possible without arguing too early about what is proven. That matters because early filtering often removes less obvious causes that later turn out to be the real source of variation.
Group, Compare, and Prioritize the Most Likely Causes
After brainstorming, the team reviews the full cause-and-effect diagram and starts grouping overlaps, removing vague wording, and identifying causes that can be tested. In the solder bridging case, “operator error” is too broad, so it gets broken into specific possibilities such as incorrect stencil cleaning frequency or failure to follow paste open-time limits. The team then compares each possible cause against actual production records, defect location maps, maintenance history, reflow temperature logs, and first-pass yield data.
This is where the fishbone diagram becomes operational rather than theoretical. Suppose the defect spike aligns with a change in solder paste lot, but only on one line and one product family; meanwhile, oven profile data shows a recent drift in peak temperature and soak time on Line 3. The team can now narrow the list to evidence-backed likely causes instead of treating every branch equally.
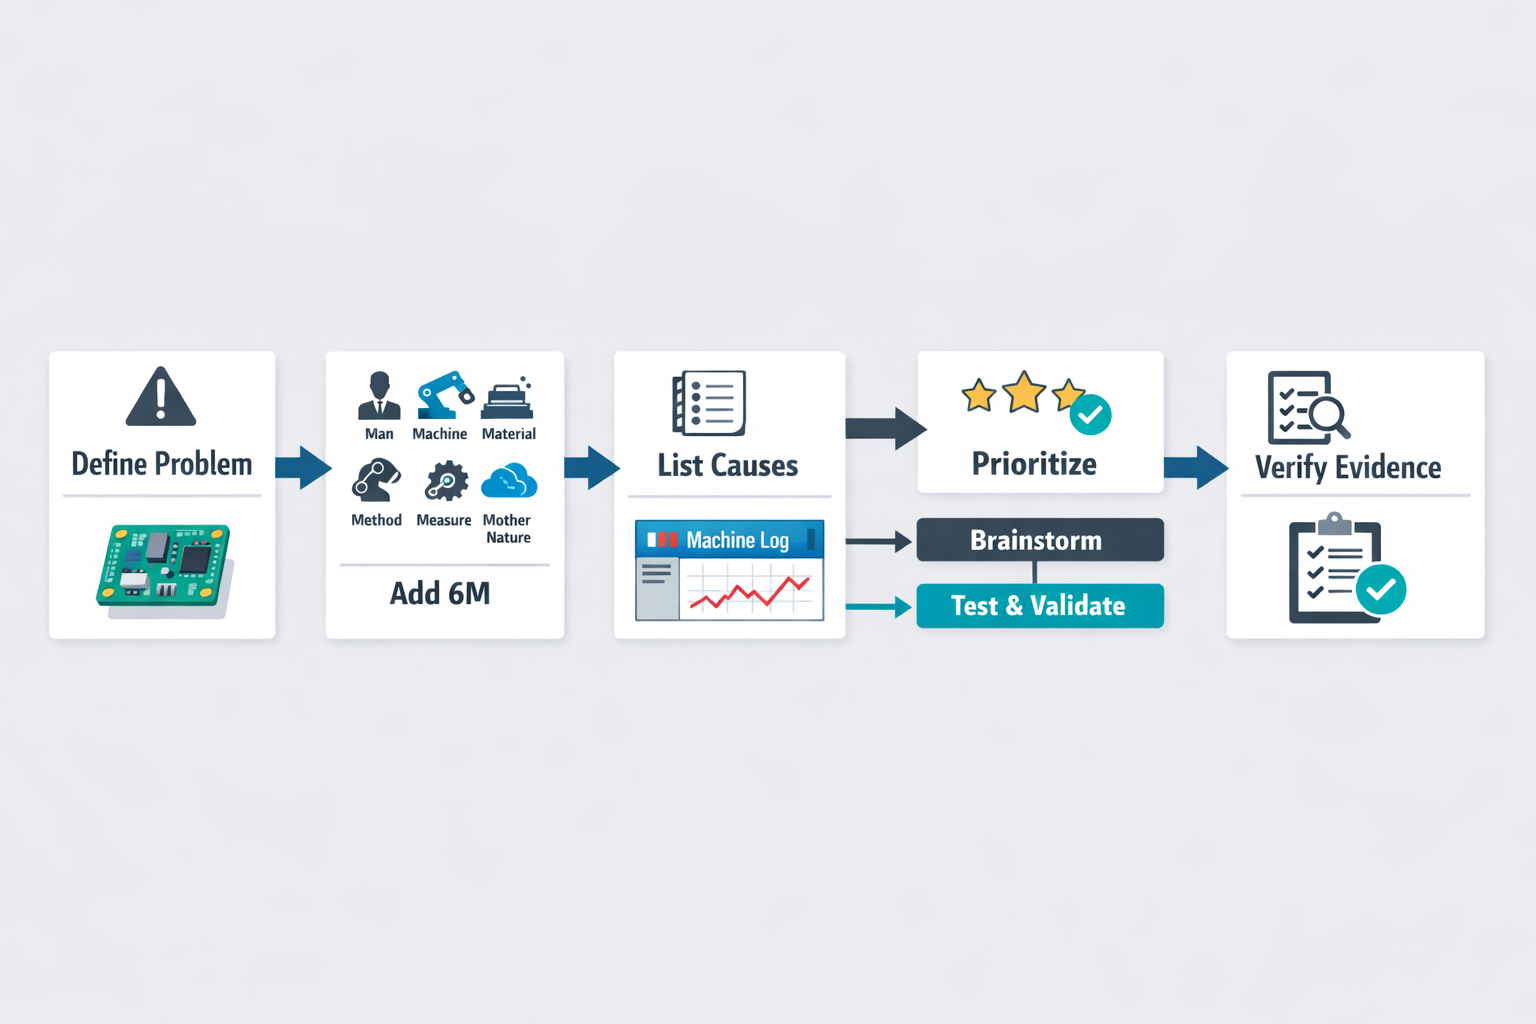
Test Likely Causes Against Shop-Floor Evidence
The next step is to verify, not guess. The team may run a controlled trial by restoring the approved reflow profile, checking stencil alignment, and comparing defect rates across the current and previous paste lots under the same operating conditions. If bridging drops after profile correction while paste performance remains stable across lots, the evidence points more strongly to process settings than to incoming material.
This step is what separates a useful Ishikawa diagram from a documentation exercise. In many factories, teams stop at brainstorming, but root cause analysis only becomes credible when suspected causes are tested against process data, trial results, or direct observation. A cause that cannot be supported should stay marked as unconfirmed.
Identify What Still Needs Verification
Even after the main likely cause is identified, the team should document open questions and required checks. In our example, the investigation may show that reflow profile drift is the primary cause, but the team still needs to verify why the drift was not detected earlier, whether preventive maintenance intervals were missed, and whether profile approval controls were followed after product changeover. Those points may not explain the defect directly, but they often explain why the defect escaped.
This final step strengthens the Ishikawa diagram as a repeatable root cause analysis tool. Instead of ending with one suspected answer, the team leaves with a confirmed cause, supporting evidence, and a short list of verification items that must be closed before the analysis is considered complete.
From Fishbone Diagram to Closed-Loop Action with Jodoo
Why the Fishbone Diagram Must Lead to Action
In many plants, the sơ đồ xương cá ends as a meeting output: a whiteboard photo, a spreadsheet attachment, or a slide in a corrective action report. That creates a gap between analysis and execution, especially when multiple departments must act on the findings. For manufacturing defect analysis to improve yield, lead time, or customer quality performance, the cause-and-effect diagram needs to feed directly into a controlled follow-up process.
This is where a digital workflow matters. Instead of treating the Ishikawa diagram as a one-time exercise, you can convert each verified cause into a structured problem record with owners, deadlines, approvals, and evidence requirements. That turns a root cause analysis tool into a repeatable operating process rather than a documentation habit.
Turning Root Cause Findings Into CAPA Tasks
TRONG Jodoo, a manufacturer can build a no-code workflow that starts with a nonconformance or defect report, links it to the root cause review, and then routes the result into corrective and preventive action tasks. A quality engineer can log the issue, attach the fishbone diagram or Ishikawa diagram example from the review session, classify causes using the 6M analysis structure, and mark which causes are suspected versus verified. That structure is useful because it prevents action items from being assigned against unproven causes.
Once the team confirms likely causes, each finding can be translated into a CAPA task with a specific owner and due date. In practice, that means a machine-related cause can go to maintenance, a method-related cause to production engineering, and a measurement-related cause to quality assurance, all within the same record. Approval steps can be added so supervisors or plant quality leaders review proposed actions before they are released.
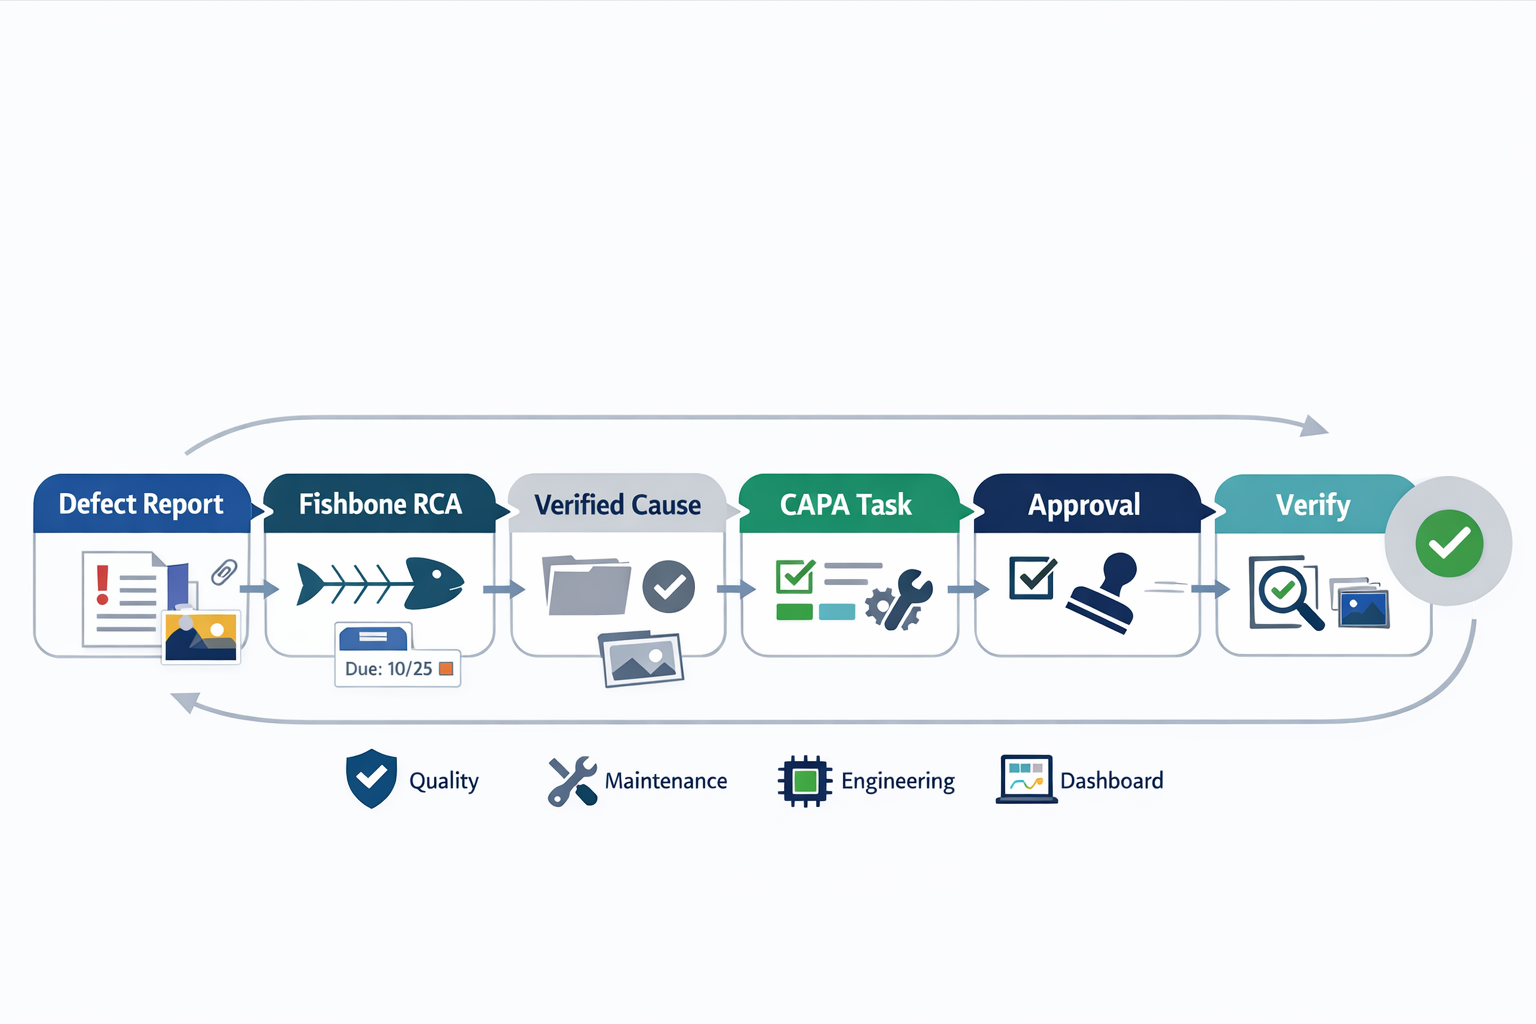
Because the workflow is digital, every action can carry required fields such as containment action, permanent correction, verification method, completion date, and supporting evidence. That matters in audit situations, where teams often lose time chasing email trails or paper forms to prove what was done and when. With role-based permissions and status tracking, managers can see which actions are overdue, waiting for approval, or still lacking verification evidence.
A Practical Automotive Supplier Example
Consider an automotive supplier investigating recurring weld defects on a bracket assembly. The team completes its fishbone diagram review and identifies two verified causes: inconsistent clamping pressure on one welding fixture and an outdated work instruction that does not reflect the latest parameter setting. Instead of recording those findings in a static report, the quality team uses Jodoo to generate linked tasks for maintenance and process engineering from the same defect case.
The maintenance task requires fixture inspection, pressure adjustment, and before-and-after photos of the clamp condition. The process engineering task requires revision of the welding instruction, operator acknowledgment, and supervisor approval before the change is released on the line. Once both tasks are marked complete, the workflow routes the case back to quality for effectiveness verification, such as tracking defect ppm or first-pass yield over the next production runs.
Building Audit-Ready Traceability Across RCA and Verification
A closed-loop process is valuable because corrective action is not the same as effective corrective action. In many factories, 20% to 30% of CAPA items can remain overdue or be closed without strong evidence, especially when follow-up is managed through disconnected spreadsheets and email chains. A connected workflow helps enforce discipline by requiring verification of data before closure, not just a checked box.
Với Jodoo, you can connect defect intake forms, RCA records, action workflows, approval steps, and dashboards in one system. That lets teams trace the full chain from defect report to fishbone findings, assigned actions, verification results, and final closure status. For plants that need stronger customer audit readiness or IATF-aligned documentation control, traceability is often the difference between a well-run root cause process and a file-based exercise.
What does This Change for Plant Teams
The operational benefit is not only better documentation but faster execution. When findings from the Ishikawa diagram move directly into assigned workflows, teams spend less time retyping information, clarifying ownership, or searching for evidence. For plants handling frequent nonconformances across shifts, lines, or suppliers, this can reduce response delays and make root cause follow-up more consistent.
Conclusion: Turn Ishikawa Analysis into a Repeatable Manufacturing Improvement System
MỘT Ishikawa diagram remains one of the most practical tools for manufacturing root cause analysis because it forces teams to look beyond the obvious defect and examine the full cause-and-effect chain. In plants dealing with recurring scrap, rework, downtime, or customer complaints, the fishbone method works best when it is grounded in evidence rather than opinion. That is why the 6M framework matters: it gives your team a consistent structure for investigating causes across people, equipment, methods, materials, measurement, and the production environment.
Just as important, a fishbone diagram should not stop at brainstorming. Its real value comes when likely causes are verified, corrective actions are assigned, and results are tracked until the problem is closed. Without that discipline, even a well-run RCA session can turn into another meeting that produces notes but not measurable improvement.
If you want to make root cause analysis repeatable across lines, shifts, and plants, Jodoo can help you build a no-code RCA and CAPA workflow that connects defect reporting, Ishikawa analysis, action ownership, approvals, and verification records in one system. You can bắt đầu dùng thử miễn phí hoặc Đặt lịch dùng thử to see how it fits your manufacturing process.