Introduction: What Root Cause Analysis Means on the Manufacturing Floor
A defect that comes back every week is rarely a one-time problem. In manufacturing, poor quality can consume 15% 至 20% 的銷售收入 in some operations when scrap, rework, delays, claims, and lost capacity are added up. That is why root cause analysis matters on the shop floor: it helps teams stop treating symptoms and start removing the underlying source of failure.
In practical terms, root cause analysis is a structured way to find why a defect, breakdown, process deviation, or recurring nonconformance happened in the first place. Instead of only replacing a worn part, sorting bad units, or restarting a line, the team looks deeper at process conditions, methods, materials, machine settings, human factors, and controls. The goal is not just recovery, but prevention.
This matters across automotive, electronics, batch processing, and discrete manufacturing because recurring issues affect every function differently. Quality managers see complaint risk and audit exposure, production managers lose output, lean leaders see hidden waste, and plant managers carry the cost of repeated instability.
In the sections that follow, we will look at when a formal root cause analysis is worth the effort, which methods fit different problem types, how to document and track corrective action, and how digital workflows help teams close the loop.
When Manufacturers Should Use Root Cause Analysis
Use Root Cause Analysis When the Same Problem Comes Back
正式的 root cause analysis is justified when the issue is not isolated, costly, or likely to repeat. Typical triggers include repeated scrap on the same part family, recurring customer complaints, repeated line stoppages, gradual process drift, supplier nonconformances that affect incoming quality, audit findings, and chronic maintenance failures on the same asset. If the problem consumes production capacity, raises COPQ, or creates customer risk, it usually deserves more than basic troubleshooting.
Many plants set clear escalation thresholds to avoid debating every incident. For example, a defect that appears across multiple shifts, a machine fault that causes repeated downtime in one week, or a complaint tied to a controlled characteristic should trigger a structured investigation. This is where root cause analysis methods become useful, not as paperwork, but as part of a disciplined problem-solving process.
Do Not Use Formal RCA for Every Small Disturbance
Not every abnormality needs a full root cause analysis. A one-time jam caused by obvious debris, a setup error corrected immediately, or a single missed scan with no repeat pattern is often best handled through routine troubleshooting and supervisor follow-up. Forcing full RCA on every minor event creates fatigue and weakens attention on the issues that truly threaten quality, delivery, or compliance.
A practical test is to ask three questions: Is the cause already known, is the fix straightforward, and is the risk of recurrence low? If the answer is yes to all three, document the event and close it through the standard response. If the answer is no, especially when evidence is conflicting or the issue crosses departments, a deeper investigation is worth the time.
Trigger Points That Usually Require a Formal Investigation
Customer-facing failures should almost always move beyond quick fixes. Warranty returns, complaint trends, escaped defects, and specification misses affecting regulated or safety-critical products need a traceable corrective action root cause record. In many sectors, especially automotive and electronics, customers and auditors expect evidence that the plant identified the true cause and not just the visible symptom.
Internal operational losses also justify a formal RCA when they are repetitive or expensive. Examples include scrap above threshold, first-pass yield decline, recurring rework, unstable cycle times, unplanned downtime on bottleneck equipment, and repeated PM misses causing the same breakdown mode. In these cases, teams may later choose between 5 Whys analysis, a fishbone diagram, Pareto review, or other root cause analysis methods, but the first decision is whether the problem merits structured escalation.
Separate Containment, Corrective Action, and Prevention
One common failure in manufacturing root cause analysis is mixing immediate response with true problem elimination. Containment is what you do now to protect the customer and keep production under control, such as sorting stock, isolating suspect lots, switching tools, or increasing inspection frequency. Corrective action removes the confirmed cause of the current issue, while preventive action changes the system so the same failure mode is less likely to return elsewhere.
These stages should not be approved as if they are equal. A team can contain a supplier defect within an hour and still need days to verify the actual cause in packaging, handling, or incoming inspection criteria. Plants that skip this distinction often report fast closure rates but continue to see repeat findings because the long-term prevention step was never completed.
Use RCA When the Cause Is Not Yet Proven
Formal analysis is especially important when teams are working with assumptions instead of evidence. If production blames maintenance, maintenance blames operator handling, and quality sees no clear trend, that is a sign the plant needs a structured investigation rather than opinion. The goal is to verify the cause with data, not to select a likely explanation and move on.
This is also why managers should avoid jumping straight into tools before deciding on the need for investigation. The method selection comes next, and later sections will compare when to use 5 Whys, a fishbone diagram, or more complex approaches. At this stage, the key decision is whether the issue has enough recurrence, cost, risk, or uncertainty to justify formal root cause analysis.
Root Cause Analysis Methods: When to Use 5 Whys, Fishbone Diagrams, and Other Tools
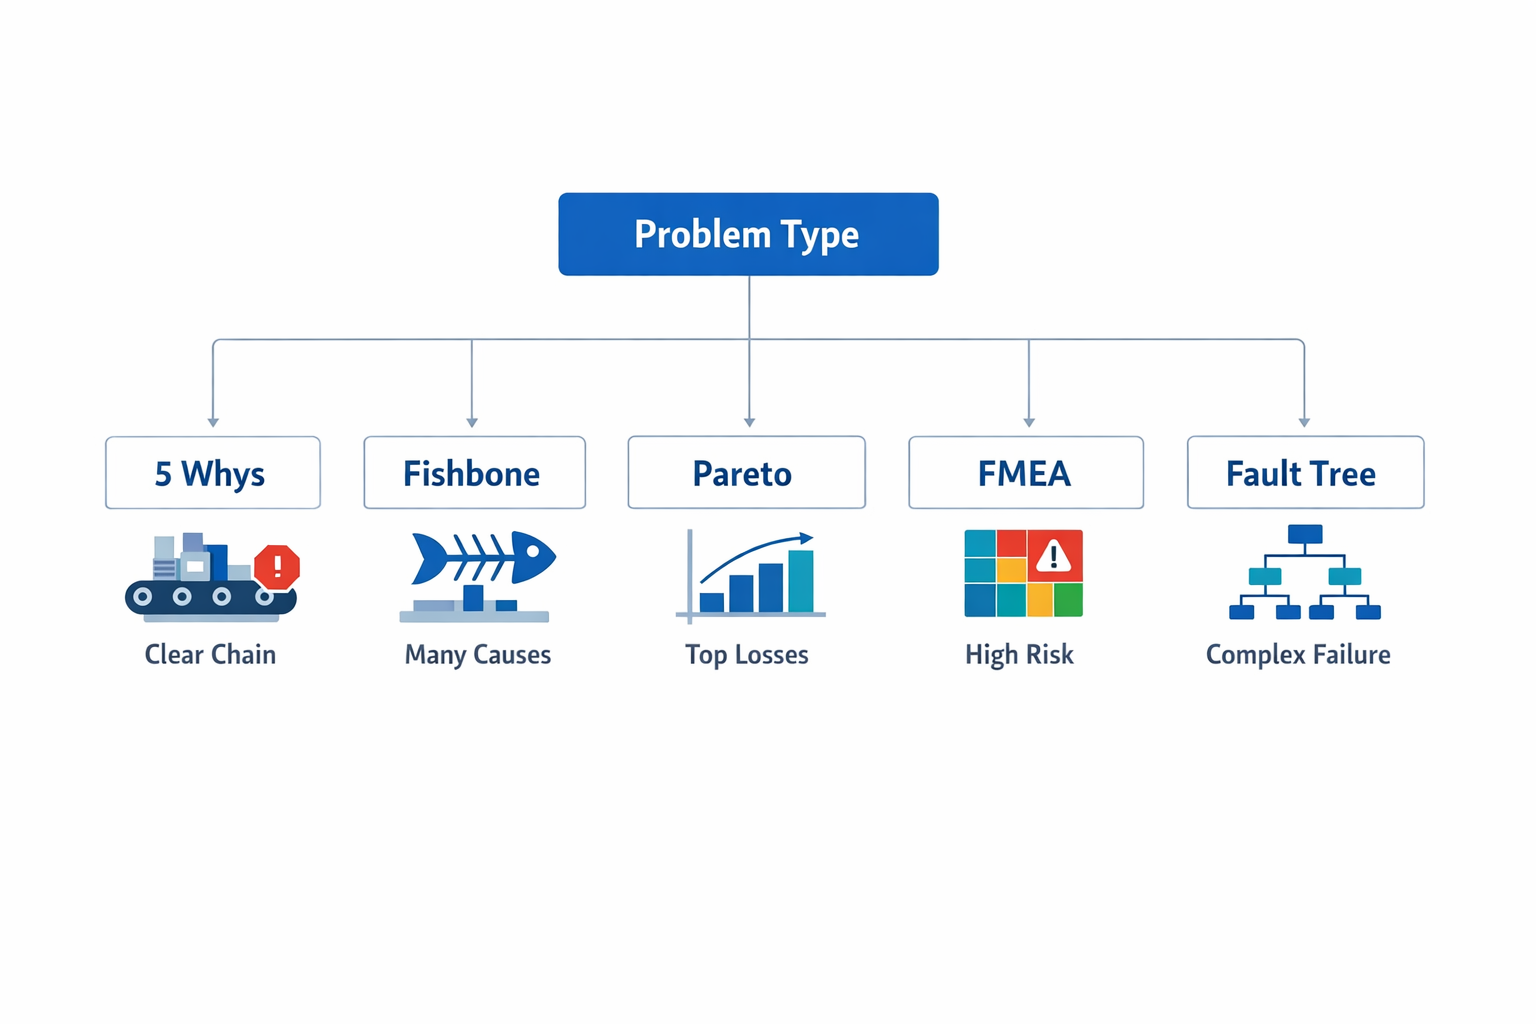
Choosing among root cause analysis methods depends on the shape of the problem, not on team preference. If the issue has a clear event chain, 5 Whys analysis is usually the fastest option. If multiple factors may be interacting across people, machines, materials, methods, and environment, a 魚骨圖 helps structure the discussion. If you need to decide which defect or failure deserves attention first, Pareto analysis is the better starting point, while FMEA 或者 fault tree analysis fits higher-risk, multi-variable problems where failure paths must be modeled more rigorously.
Use 5 Whys for a Clear Cause-and-Effect Chain
使用 5個為什麼 when the issue is narrow enough that the team can trace a direct sequence from symptom to cause. This works well for one machine stop, one repeated assembly error, or one specific nonconformance where the process path is already known. The value is speed: many plants can complete an initial 5 Whys review in 15 to 30 minutes if the right operator, supervisor, and engineer are present.
For example, a packaging line keeps rejecting cartons because barcode labels are misaligned. The team asks why the labels are misaligned, then keeps drilling down until they find that the label applicator bracket loosens during changeovers because the torque standard is missing from the setup sheet. In that case, the root cause is not “operator error” but an uncontrolled setup method.
Use a Fishbone Diagram When Causes May Be Coming From Several Sources
A 魚骨圖, also called an Ishikawa or cause-and-effect diagram, is useful when the problem is broader and the likely causes span departments. It forces the team to sort possible causes into practical manufacturing categories such as Man, Machine, Material, Method, Measurement, and Environment. This makes it especially effective for root cause analysis when quality, production, maintenance, and supplier quality all need to contribute.
Consider an injection molding plant facing recurring short shots on one product family. Maintenance suspects inconsistent hydraulic pressure, production points to startup practices, and quality flags resin moisture variation. A fishbone session helps the team map all three possibilities before jumping to conclusions, which is often the difference between a valid investigation and a meeting driven by opinions.
Use Pareto Analysis to Decide What to Solve First
Some factories do not have one dominant problem; they have too many. In that case, Pareto analysis helps you rank issues by frequency, scrap cost, downtime minutes, or customer impact so the team does not spend time investigating low-value noise. In many plants, a small number of defect types account for most losses, consistent with the classic 80/20 pattern, even if the exact ratio varies.
For example, an electronics plant may log 12 defect categories across final test, but data shows that solder bridging and missing components account for 68% of all defects over the last quarter. That does not complete the root cause analysis by itself, but it tells the team where to apply deeper tools first. Pareto is therefore a prioritization tool within the broader problem-solving process, not a substitute for verification.
Use FMEA for High-Risk or Process-Critical Failure Modes
Failure Mode and Effects Analysis (FMEA) is the right tool when you need to evaluate not just one failure, but a range of possible failure modes before they escalate. It is widely used in automotive, medical device, and other regulated sectors because it helps teams assess severity, occurrence, and detection in a structured way. AIAG-VDA-aligned FMEA practices are now common in global supply chains, especially where customer-specific requirements demand documented risk reduction.
A machining supplier launching a new shaft process might use FMEA to assess the risk of out-of-tolerance diameter, burr formation, or inadequate surface finish before full production ramp-up. Unlike 5 Whys, which usually starts after a problem appears, FMEA is often preventive. It is best when the cost of failure is high, and the process has enough complexity that reactive troubleshooting would be too late.
Use Fault Tree Analysis for Complex Technical Failures
Fault tree analysis is useful when a critical failure can result from several interacting technical conditions and you need to work backward logically. It starts with the top event, such as a furnace trip or a pressure loss, and maps the combinations of failures that could produce it. This method is common in process industries, utilities, and safety-critical operations where one incident may involve controls, instrumentation, power, and mechanical systems at the same time.
For example, a batch chemical plant investigating an unplanned reactor shutdown may use a fault tree to test whether the trip came from sensor drift, valve failure, PLC logic, or an upstream utility interruption. That level of structure is more rigorous than a brainstorming exercise and more suitable when compliance, safety, or major production loss is involved. Among root cause analysis 方法, it is one of the most useful for technically layered events.
A Practical Rule for Method Selection
In practice, many factories combine these tools instead of choosing only one. A team might use Pareto to identify the biggest defect, a fishbone diagram to surface possible causes, and then 5 Whys to validate the most likely cause chain. For more critical processes, FMEA or fault tree analysis adds the discipline needed to manage risk beyond a single incident.
The key is to match the tool to the decision you need to make. If you need speed, use 5 Whys. If you need broader cross-functional visibility, use a fishbone diagram. If you need prioritization, use Pareto; if you need deeper risk logic, use FMEA or fault tree analysis.
How to Run a Root Cause Analysis Step by Step in Manufacturing
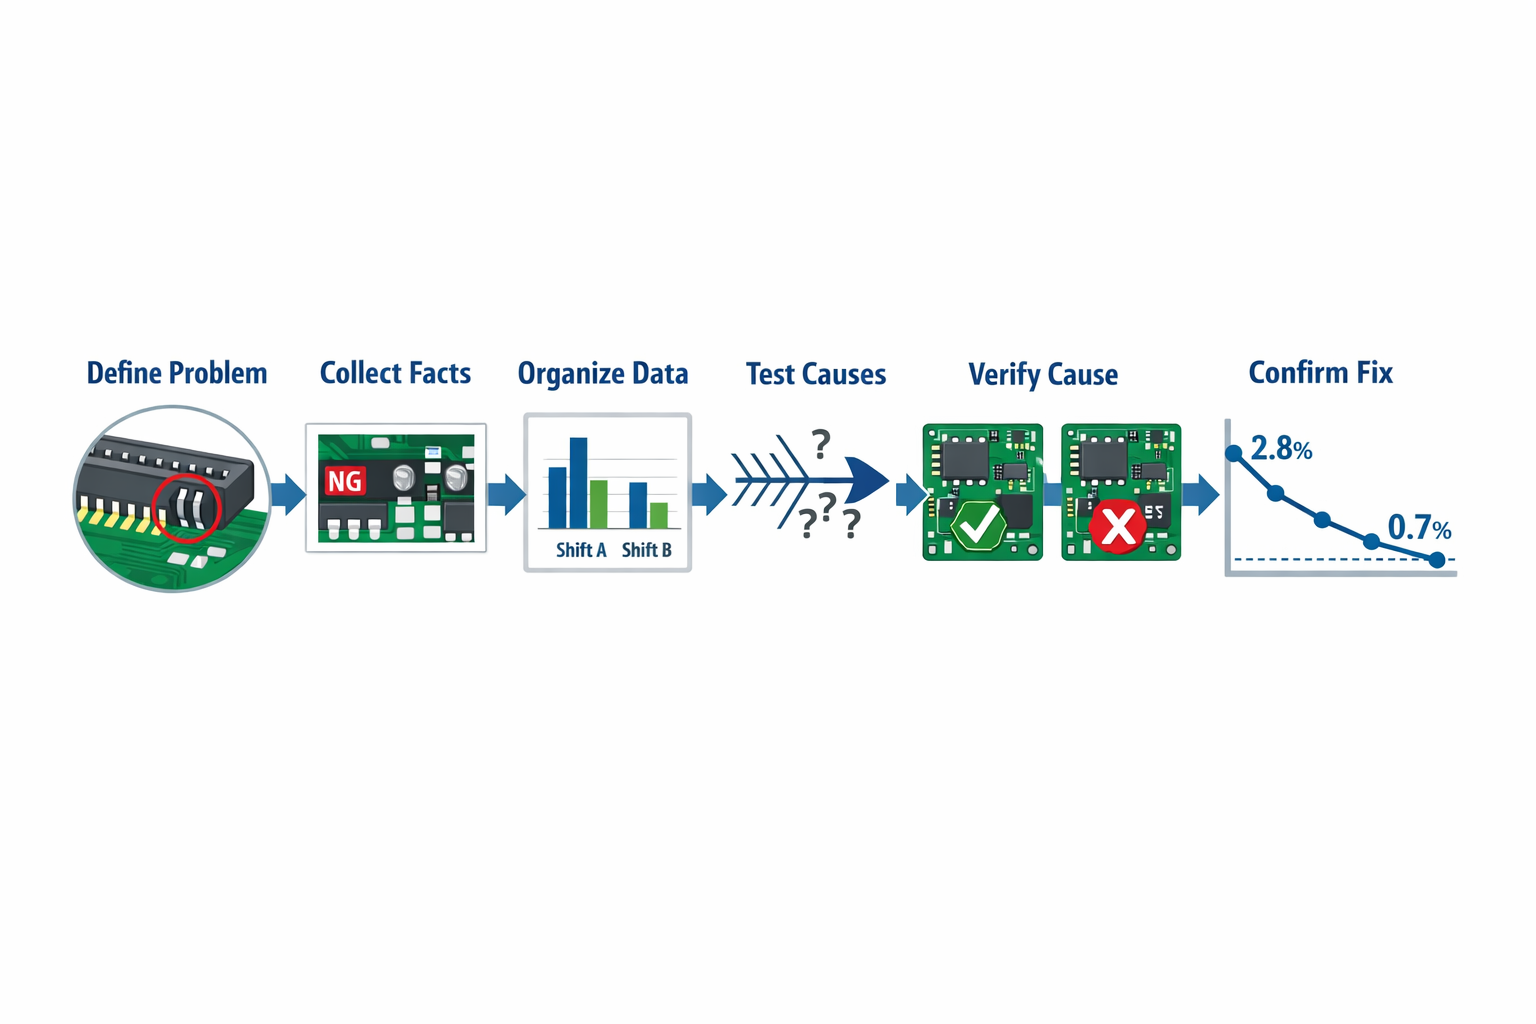
A strong manufacturing root cause analysis should move in a clear sequence: define the problem, gather facts, test likely causes, verify the true cause, assign corrective action, and confirm that the fix actually works in production. To make that practical, let’s follow one recurring issue in an electronics assembly line: intermittent solder bridging on a PCB connector station that is driving 2.8% rework across three shifts. The goal is not to produce a perfect report on day one, but to move from symptom to verified cause with enough evidence that the team can act confidently.
Define the Problem Precisely
Start with a problem statement that is specific enough to investigate and narrow enough to prove. “Poor solder quality” is too broad, while “solder bridging at connector J17 on SMT line 2 increased from 0.6% to 2.8% over the last 12 production days, mainly on night shift lots B41 to B56” gives the team a measurable starting point. A good root cause analysis begins with what happened, where, when, how often, and against what standard.
In this example, the quality engineer documents the defect code, affected product family, inspection point, and baseline trend from the previous month. The team also records immediate containment, such as segregating suspect lots and increasing AOI sampling, because containment protects output while the problem-solving process continues. That separation matters: containment is not the same as finding the corrective action root cause.
Collect Facts From the Floor
Once the issue is defined, go to the process and collect direct evidence before assumptions take over. For the solder bridging issue, that means reviewing AOI images, checking stencil condition, confirming solder paste lot numbers, observing printer setup, and comparing machine settings across shifts. If possible, collect data from the exact time window when the defect rate increased rather than relying on general process history.
Floor facts should include both process data and context data. In this case, the team captures temperature and humidity readings, squeegee pressure, paste age, cleaning frequency, feeder changes, operator assignments, first-pass yield by shift, and maintenance logs for the stencil printer. This is where many root cause analysis examples succeed or fail: if the data is incomplete, the team ends up debating opinions instead of testing evidence.
Organize the Evidence Before Debating Causes
After collection, organize the information so patterns become visible. A simple timeline, defect stratification table, or shift comparison often reveals more than a long discussion in a meeting room. For this electronics case, the team sorts defects by line, shift, connector position, paste lot, and operator, then maps the increase against printer cleaning intervals and ambient humidity.
The pattern shows that most bridging occurs on line 2 during the night shift, especially after longer printer run times. That does not prove the cause, but it narrows the field and gives structure to the next step. This is also the point where teams may use root cause analysis methods such as a 5 Whys analysis 或 魚骨圖 to organize possible contributors without jumping too quickly to one explanation.
Identify Likely Causes Systematically
Now the team develops hypotheses based on the evidence, not on hierarchy or habit. In our example, a cross-functional group from quality, process engineering, maintenance, and production lists possible causes: insufficient stencil cleaning frequency, solder paste viscosity drift, misalignment during setup, worn squeegee blades, humidity variation, and inconsistent night-shift parameter checks. A fishbone diagram can help structure these across machine, method, material, man, measurement, and environment.
For a more direct cause chain, the team also runs a 5 Whys exercise on the strongest pattern. Why is bridging increasing? Because excess paste is being deposited on the connector pads. Why is excess paste being deposited? Because the aperture release is degrading during longer runs. Why is the release degrading? Because the underside stencil cleaning is happening less often than needed for this product. Why is cleaning less frequent? Because the standard interval was copied from another board family with larger pad spacing. That gives the team a testable suspected cause, not yet a confirmed one.
Verify the True Root Cause
The most important step in root cause analysis is verification. A suspected cause becomes the true root cause only when the team can show that it explains the failure and that changing it changes the outcome. In this case, the process engineer runs a controlled trial on line 2, reducing stencil underside cleaning from every 15 boards to every 8 boards while holding other settings constant.
The result is immediate and measurable: solder bridging on the targeted connector falls from 2.8% to 0.7% over the next monitored lots, while comparable boards on the old interval continue to show higher defects. The team also confirms that stencil wear, paste lot variation, and placement offsets are within normal limits, which helps rule out competing explanations. That verification step is what separates a disciplined manufacturing root cause analysis from a plausible but unproven guess.
Assign Corrective Action and Prevent Recurrence
Once the root cause is verified, document actions that address both the local issue and the system gap that allowed it to persist. For the connector defect, the immediate corrective action is to revise the cleaning interval for that board family and update the machine recipe. The preventive action is broader: update NPI process validation rules so that stencil cleaning frequency must be confirmed by pad geometry and defect history before production release.
Each action should have an owner, a due date, required approval, and an expected result. In this case, process engineering owns the recipe update, production supervision owns shift-start verification, and quality owns the revised control plan and audit check. Good root cause tracking does not stop at “training completed” or “instruction updated”; it links every action to a measurable control in the process.
Confirm Effectiveness and Close the Loop
The final step is to confirm that the fix stays effective after implementation, not just during the first trial. For the PCB line, the team tracks solder bridging, first-pass yield, and rework hours for four weeks across all shifts, then checks whether the new standard is consistently followed. If the defect returns, the analysis is not closed, even if all action items show as completed.
In this example, the line sustains bridging below 0.8% for a full month, and audit checks show the new cleaning interval is built into setup verification. That is a closed-loop result: the problem statement, evidence, cause verification, corrective action, and effectiveness check all connect in one documented record. This is the level of discipline that makes future root cause analysis methods more reliable and prevents the same issue from reappearing under a different label.
What a Standardized RCA Record Should Capture
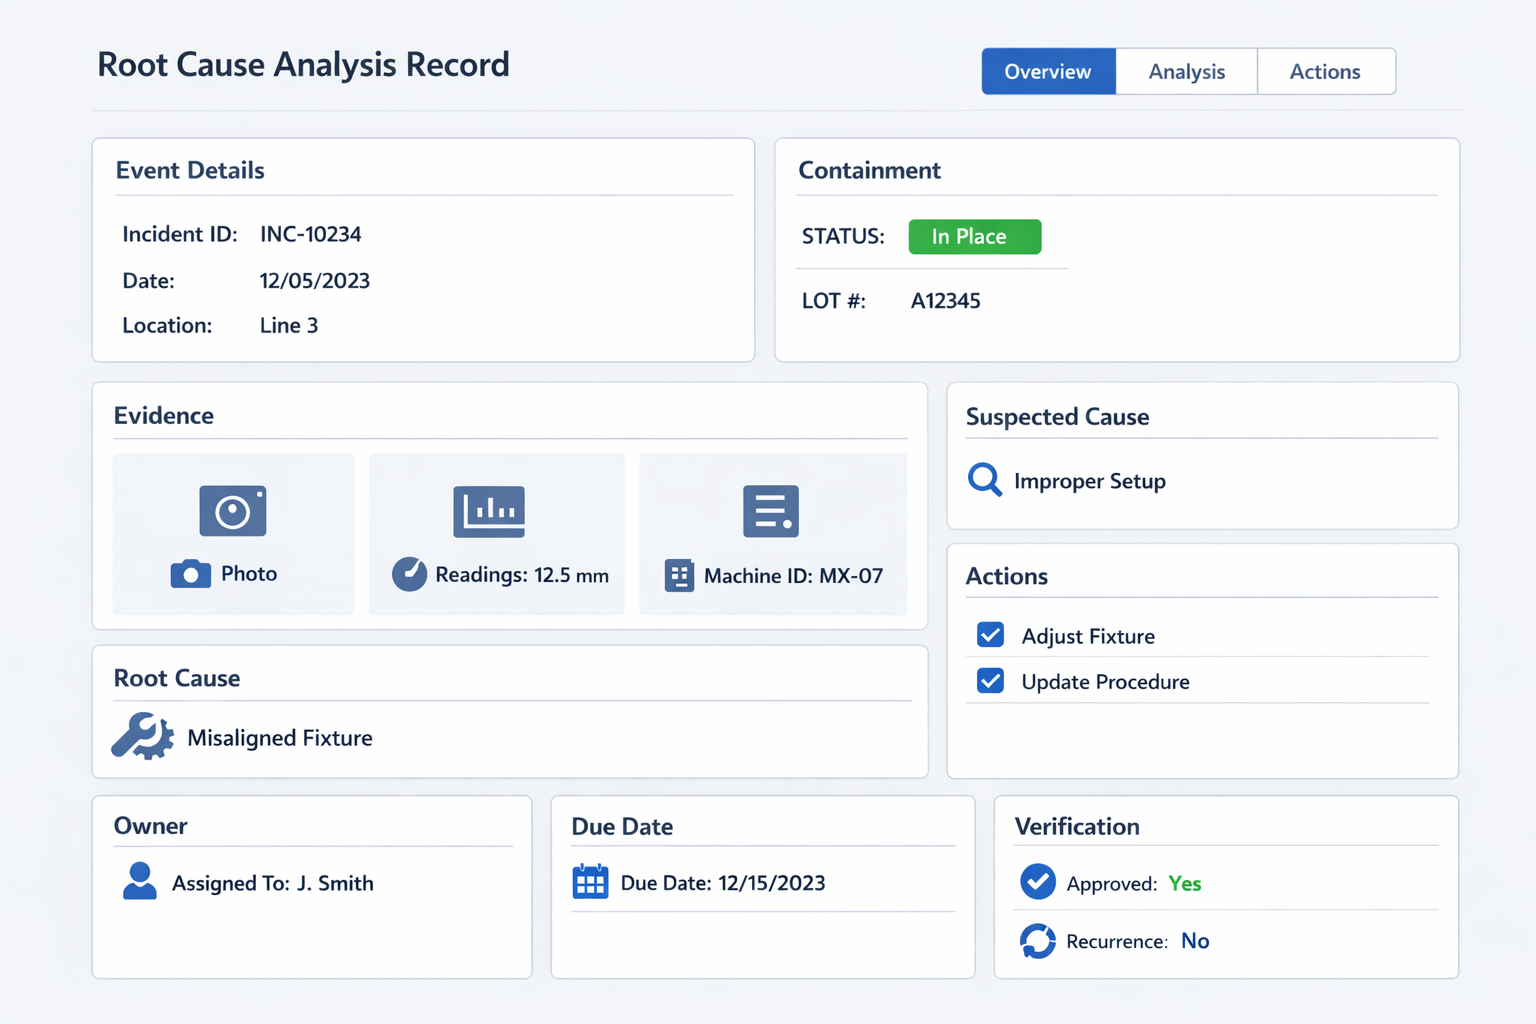
有用的 root cause analysis record should capture more than the conclusion. At minimum, teams should log the event time and date, site, line, process step, machine or asset ID, product or part number, shift, operator or crew context, defect or downtime category, and immediate containment taken. The form should also include photos, test results, sample measurements, lot numbers, maintenance history, and any reference documents that support the investigation.
Just as important, the record should separate suspected cause, confirmed root cause, , 和 糾正措施 so teams do not close cases based on assumptions. Add fields for the investigation method used, such as 5 Whys or fishbone, the action owner, target due date, approval status, and verification result after implementation. If you want the RCA to support audits and continuous improvement later, include recurrence checks, effectiveness review date, and whether the action changed a control plan, work instruction, inspection method, or preventive maintenance standard.
Why Documentation Quality Determines RCA Value
Poor documentation turns a valid investigation into a one-time discussion that cannot be reused. If records only say “operator error” or “machine issue,” future teams cannot compare patterns across lines, shifts, suppliers, or product families. By contrast, structured RCA data allows quality and operations leaders to trend recurring causes, identify weak controls, and prioritize the next problem-solving process based on facts rather than opinion.
This is also where many root cause analysis methods either create value or lose it. A fishbone diagram on a whiteboard may help a meeting, but it adds little if the verified cause, evidence, owner, and effectiveness check are not captured in a searchable format. Over time, plants that standardize RCA records build a practical knowledge base of failures, fixes, and verification outcomes that improves both response speed and prevention quality.
Conclusion: How Jodoo Helps Manufacturers Turn RCA Into Corrective Action and Continuous Improvement
Root cause analysis creates results only when the process goes beyond diagnosis. On the factory floor, that means the issue is recorded consistently, evidence is captured at the source, corrective actions are assigned to clear owners, and effectiveness is verified after implementation. Without that closed loop, many plants end up repeating the same investigations, especially when findings are stored in email threads, paper forms, or disconnected spreadsheets.
As a 無程式碼精實製造平台, Jodoo lets manufacturers build a connected RCA workflow for issue reporting, photo and measurement capture, root cause documentation, approval routing, action tracking, overdue reminders, and dashboard visibility. Instead of chasing updates manually, quality, production, and maintenance teams can work from one system with role-based access and a shared status view.
If you want to digitize root cause analysis without heavy custom development, you can 開始免費試用 或者 預約演示 與 Jodoo 合作。.