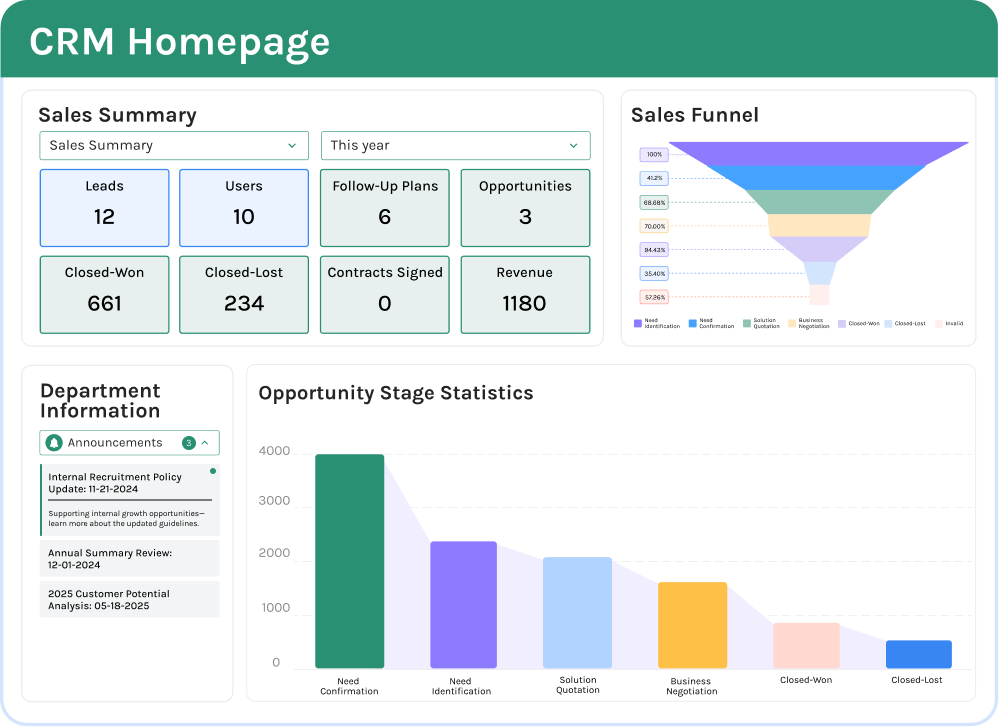
Make your decisions data-driven with live dashboard
Monitor key metrics in real-time, uncover hidden trends with diverse and easily customizable charts, pivot tables, and dashboards, and effortlessly generate shareable reports for confident executive presentations.
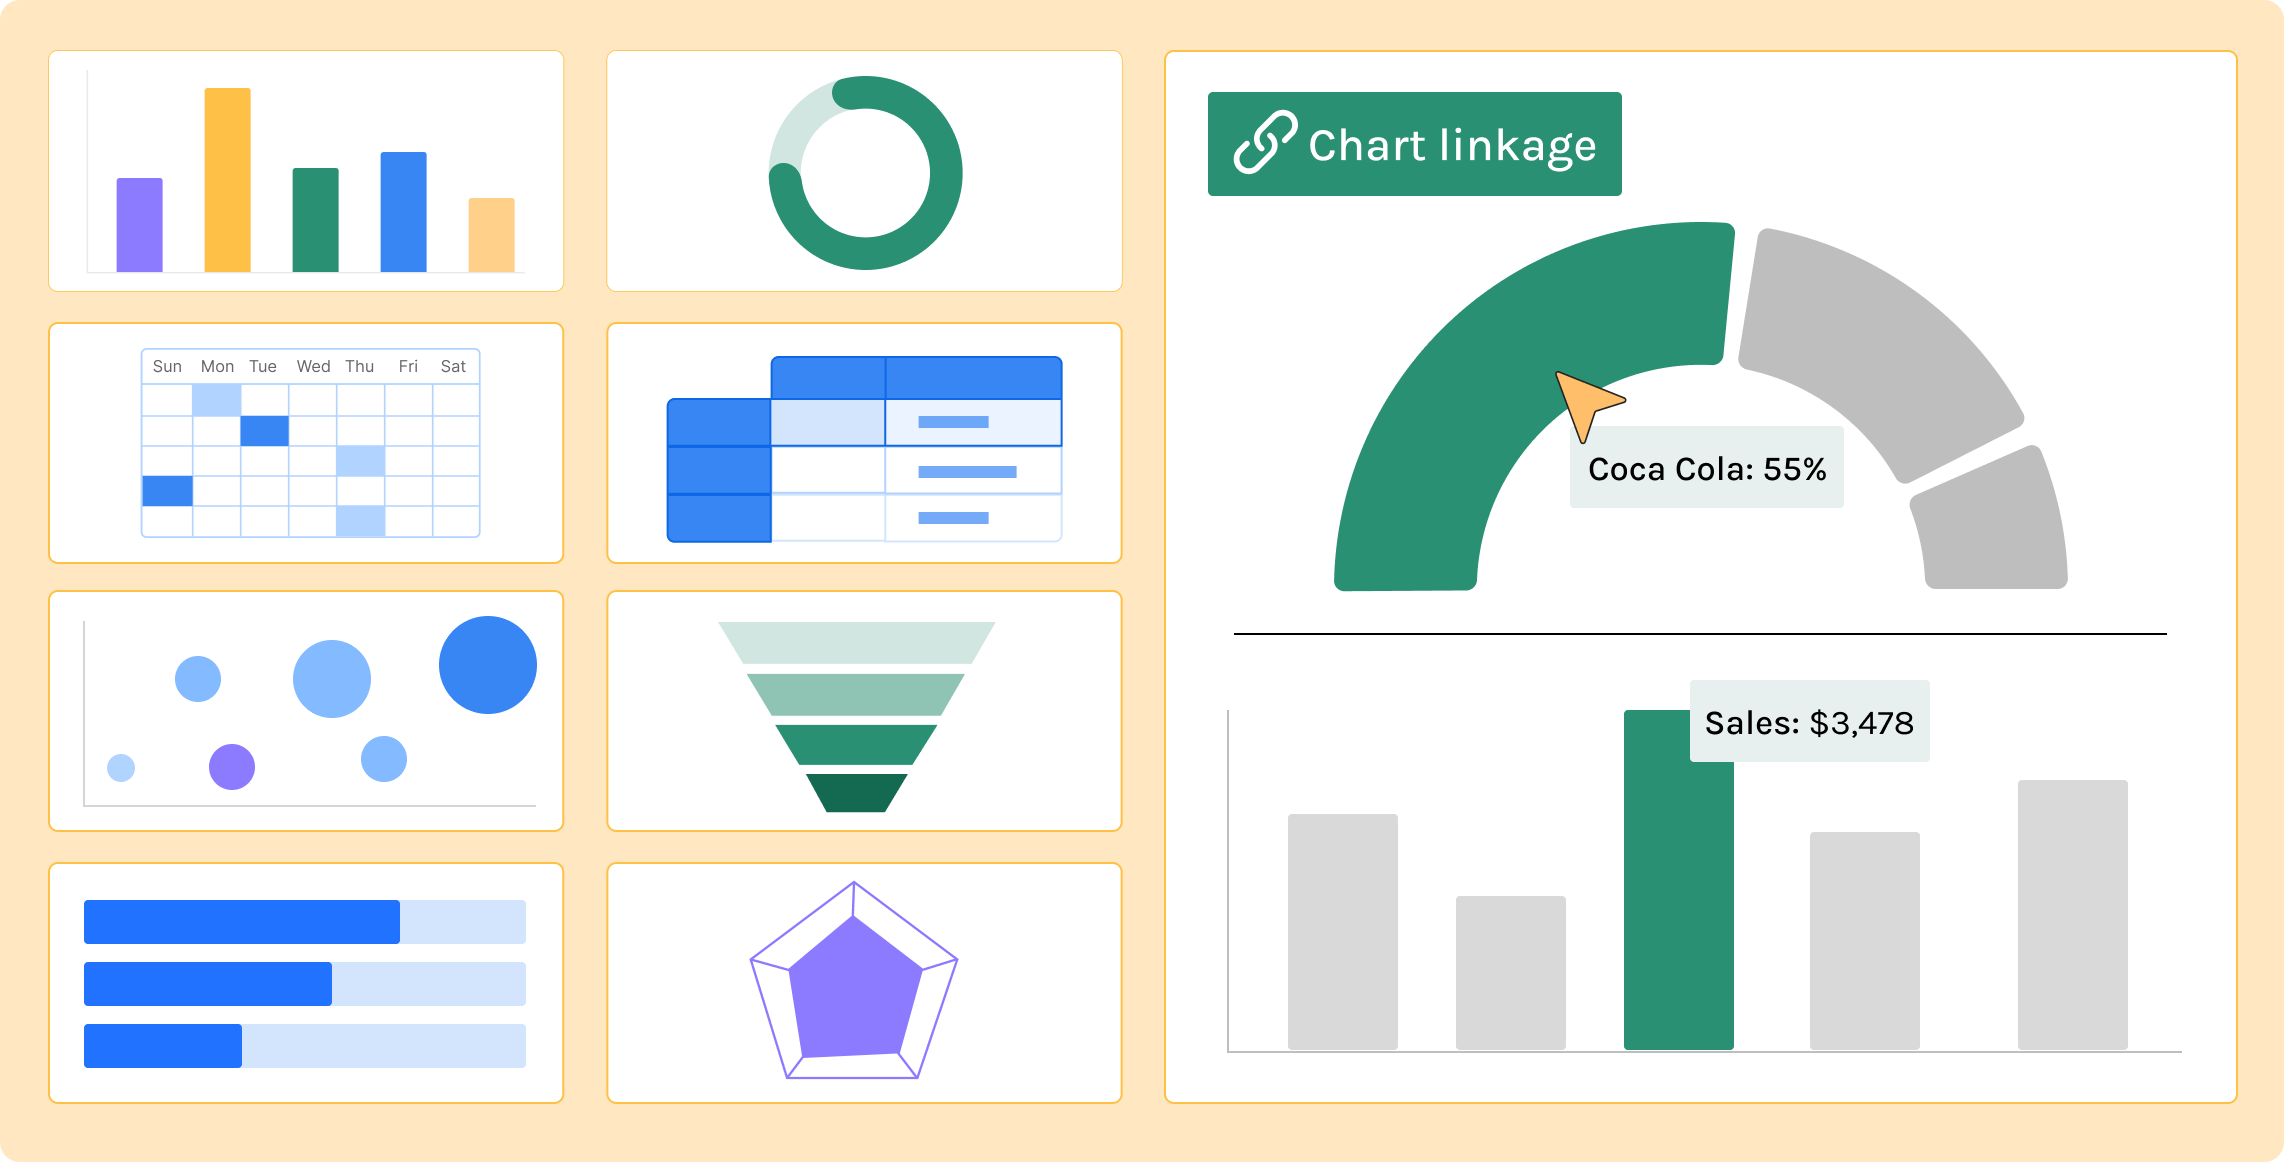
Customize charts and components like funnel, Gantt charts, pivot tables, text, embeds, and banners. Connect charts and make them interactive to filter or drill down for granular details and transform data into insights.
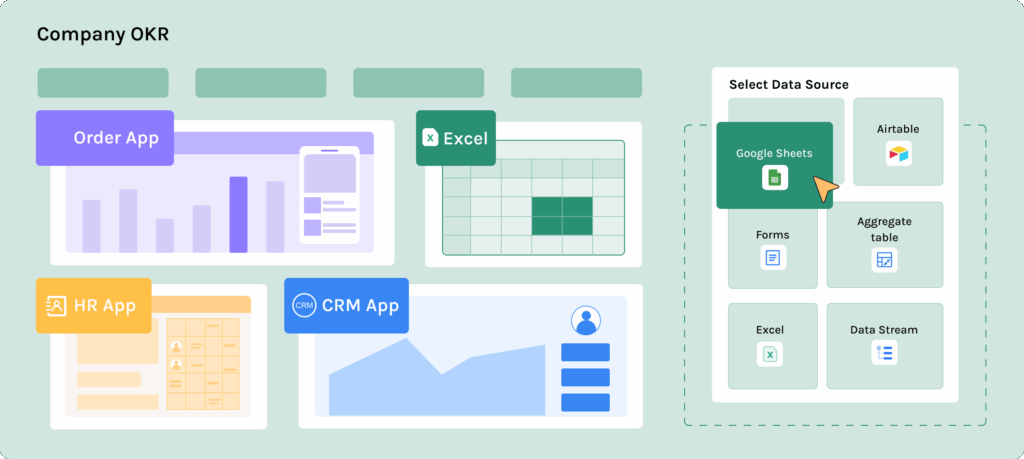
Unify your data by creating interconnected charts that pull information from various tables or even separate Jodoo applications, providing a comprehensive understanding of your business.
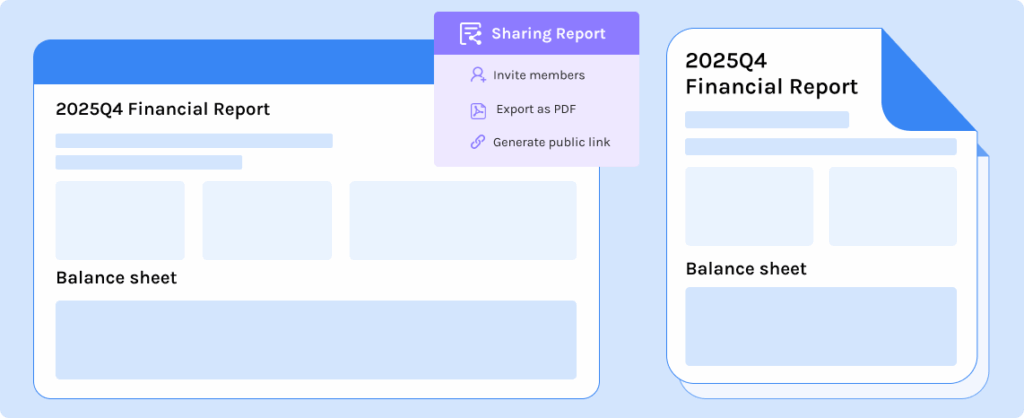
Empower leadership with clear and actionable intelligence
Securely share insightful reports with managers and executives by inviting them to view within the platform, sharing protected public links, or generating professional PDF documents for easy offline access and printing.
From the office to the field, Jodoo’s dashboards are at your fingertips on any device—mobile phones, computers, iPads, TVs, and even specialized industrial equipment.
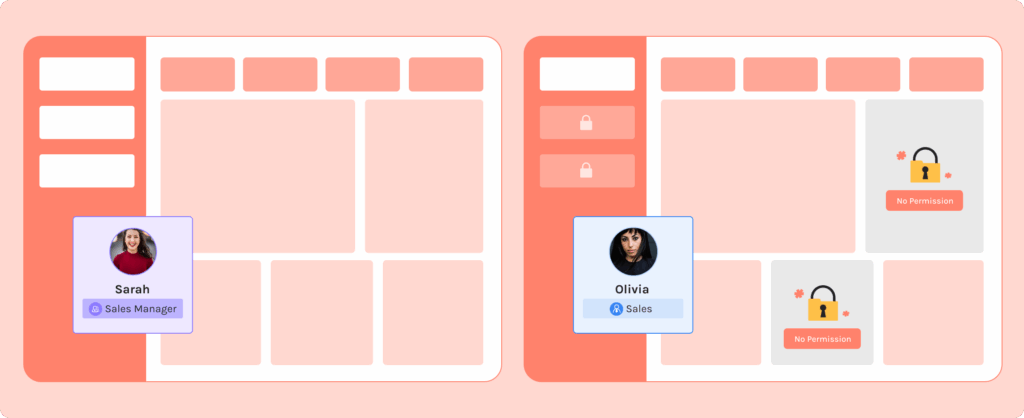
Control exactly who can view and interact with data
Maintain strict control over your dashboard’s visibility. Assign precise viewing permissions based on teams, roles, or individual users, safeguarding sensitive data while empowering the right people with the information they need.
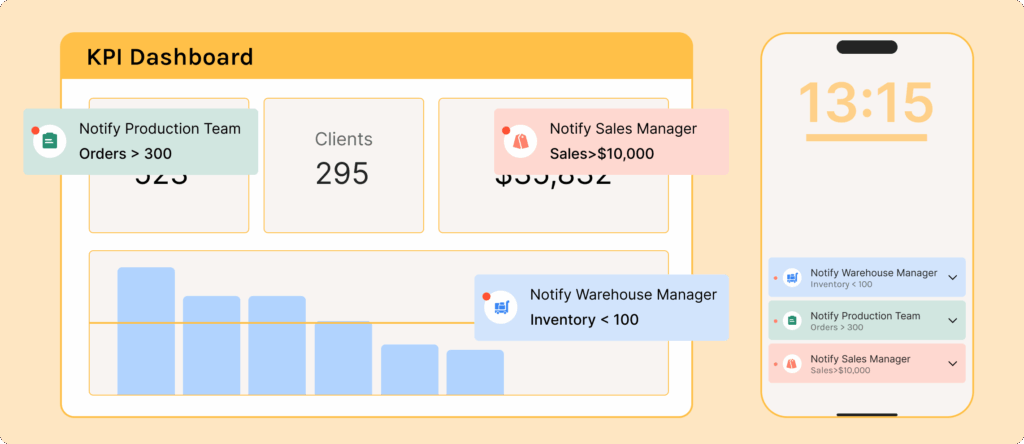
Get instant updates on your key metrics and receive intelligent warnings for any abnormal data, like insufficient inventory, so you can take immediate action.