Introduction: What MTTR Means on the Manufacturing Floor
A single equipment failure can stop an entire line, but the highest cost often comes from how long it takes to recover. In many factories, just one hour of unplanned downtime can cost thousands of dollars in lost output, labor disruption, and delayed shipments. That is why MTTR (Mean Time To Repair) matters on the manufacturing floor: it tells you, in practical terms, how quickly your team can restore equipment after a breakdown.
MTTR is the average time required to diagnose a fault, repair the issue, verify the fix, and return the asset to normal operation. For maintenance managers and plant leaders, it is a working metric that shows whether breakdown handling is disciplined, repeatable, and fast enough to protect throughput.
This article focuses on one core question: how can manufacturers measure repair time consistently, calculate MTTR correctly, and reduce it in day-to-day operations? We will break down the formula, clarify how MTTR differs from metrics like response time and reliability, and show why high repair times often come from weak workflows, incomplete downtime records, and slow handoffs—not only from technical complexity.
How to Calculate MTTR
The Basic MTTR Formula
の MTTR formula is straightforward: total repair time for unplanned failures ÷ number of repairs. In manufacturing, the key challenge is usually not the math but the rule set behind the clock. If your team does not define the same start and stop points every time, your MTTR calculation will not be reliable enough to support maintenance planning or downtime reduction.
For most plants, MTTR should be calculated only from unplanned breakdown events on maintainable equipment. That keeps the metric focused on actual failure recovery rather than scheduled maintenance, changeovers, or engineering modifications. If you mix those activities, the result may look precise, but it will not reflect true repair performance.
What Should Count Toward the MTTR Clock
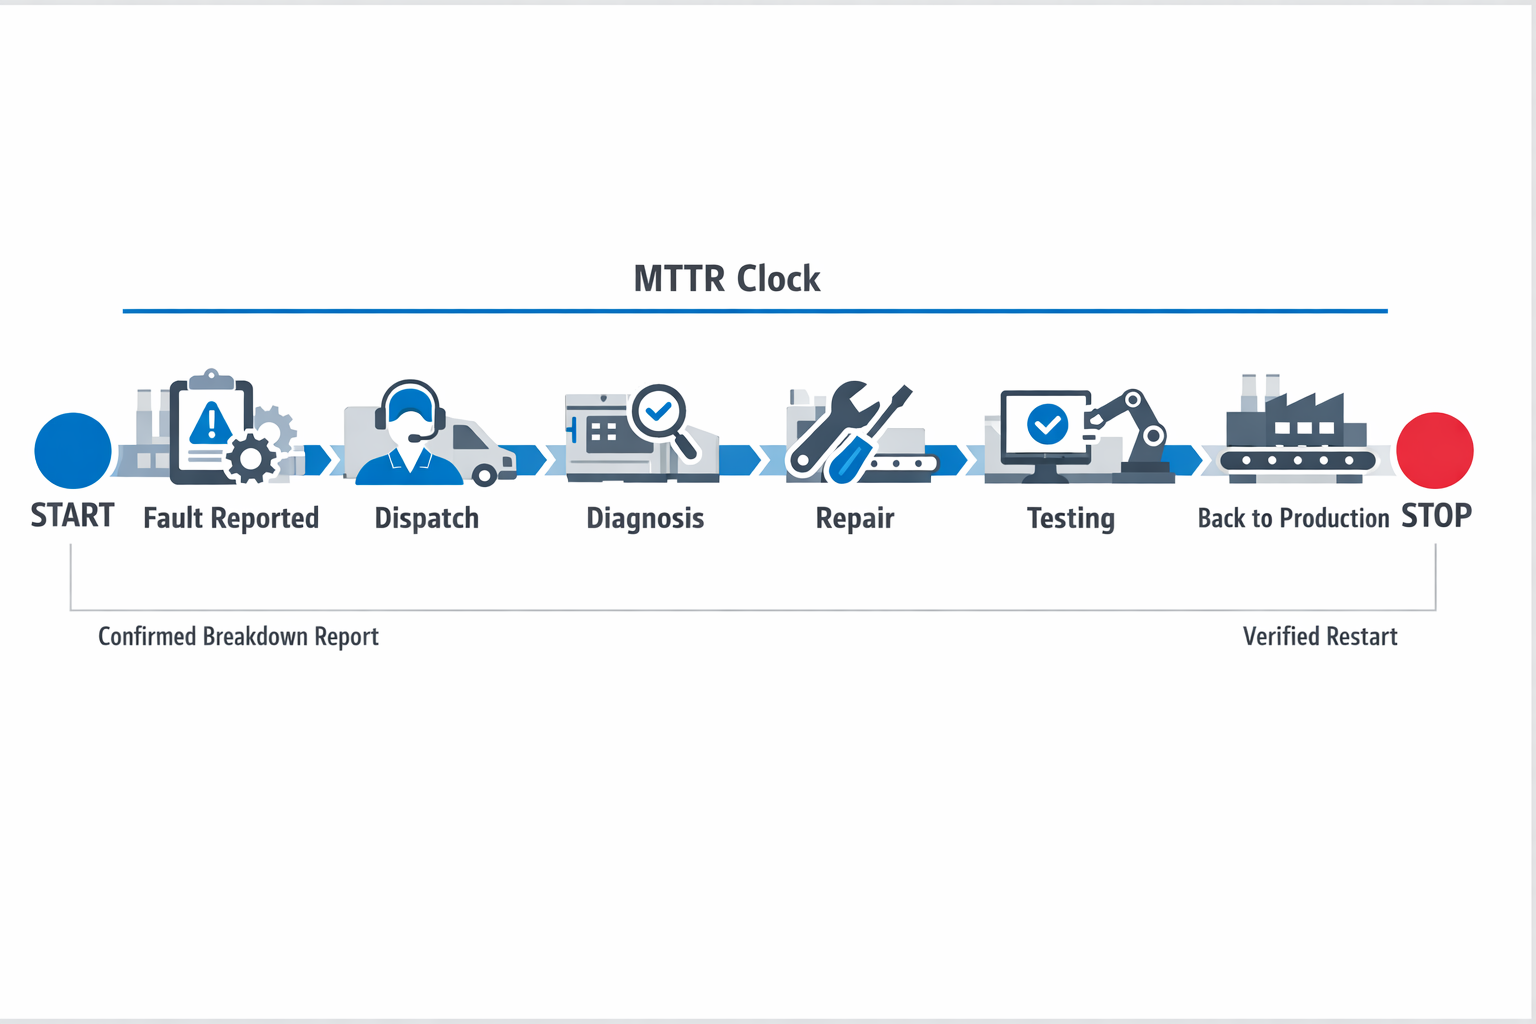
A practical shop-floor rule is to start the clock when the failure is reported or when the machine stops, and a breakdown is confirmed, then stop the clock when the asset is tested and returned to normal production. In most factories, that means the MTTR clock includes fault reporting, technician dispatch, diagnosis, repair work, testing, and restart verification. This is the most useful approach when your goal is accurate equipment downtime tracking from breakdown to recovery.
Some teams choose to exclude the waiting period before a technician arrives and track that separately as maintenance response time. That can be valid, but only if the rule is documented and applied consistently across all assets, shifts, and sites. If one line includes response delay and another does not, your MTTR numbers will not be comparable.
A Simple MTTR Calculation Example
Take one carton-filling machine that fails three times in one month. In the first event, the machine stops at 09:10 and returns to stable production at 10:00, for 50 minutes. In the second, it stops at 14:20 and restarts at 15:05, for 45 minutes; in the third, it stops at 21:40 and resumes at 22:55, for 75 minutes.
The total repair time is 50 + 45 + 75 = 170 minutes. The number of repair events is 3, so the MTTR calculation is 170 ÷ 3 = 56.7 minutes. In reporting, most plants would round that to 57 minutes MTTR for that machine over the period.
Timing Rules That Prevent Bad Data
Your team should write down one standard for when the clock starts and stops. For example, start at “breakdown logged in the maintenance system” and stop at “machine passes functional test and is released to production.” That rule is more important than whether your number is slightly higher or lower, because 一貫性 is what makes trend analysis useful.
It also helps to define what does ない belong to MTTR. Planned preventive maintenance, scheduled shutdown work, and improvement projects should sit outside this metric unless your plant intentionally uses a broader downtime measure. If your purpose is to reduce MTTR, the cleanest approach is to keep the dataset focused on failure-recovery events only.
Common MTTR Calculation Mistakes
One common mistake is using different start points across shifts, such as one supervisor logging from operator call time while another logs from technician arrival. Another is stopping the timer at “repair completed” even though the machine still needs test runs, parameter adjustment, or quality release before it is truly back in service. Those small differences can distort monthly trends and make one area look better or worse than it actually is.
A second mistake is combining planned jobs with emergency breakdowns in the same report. For example, a two-hour scheduled bearing replacement should not be averaged together with actual unplanned stoppages if you want a true view of repair speed. Clear event coding is essential if you want MTTR to support decisions on staffing, spare parts, and process improvement rather than just populate a KPI dashboard.
MTTR vs. MTBF, MTTF, and Response Time: What Each Metric Tells You
Once you understand the MTTR formula and your timing rules, the next step is making sure you do not use MTTR to answer the wrong question. Mean time to repair tells you how quickly your team restores equipment after a failure, but it does not tell you how often that asset fails or how long it runs reliably between failures. That is why maintenance leaders need a small set of related metrics, each tied to a different operational decision.
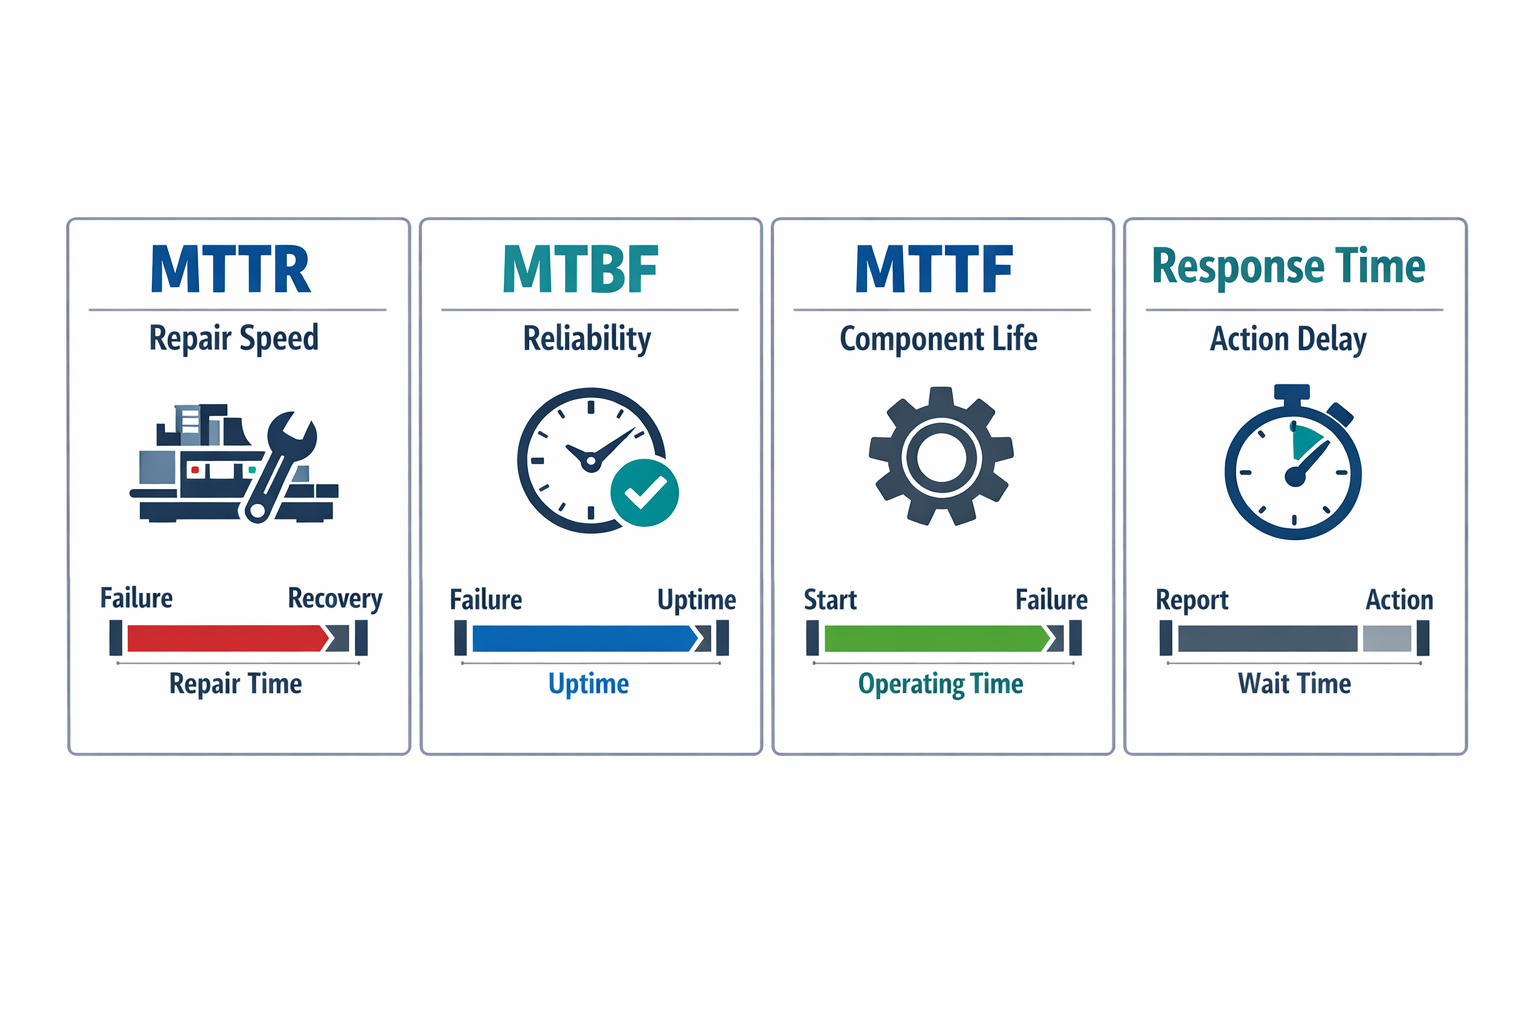
A simple way to compare them is this: MTTR measures repair speed, MTBF measures reliability between failures for repairable assets, MTTF measures expected operating life for non-repairable items, and maintenance response time measures how fast action begins after a fault is reported. Equipment downtime tracking supports all of them by providing the timestamps and failure records needed to calculate each metric consistently. If your team mixes these measures, your analysis will quickly point to the wrong root cause.
MTTR: How Fast You Restore Production
MTTR is the metric plant managers usually watch when they want to know how long a breakdown keeps a machine out of service. In practical terms, the MTTR meaning is straightforward: from the start of a repair event to verified return to operation, how much time did it take on average? It is most useful when your goal is to improve troubleshooting, repair execution, spare parts access, handoffs, and restart discipline.
For operations leaders, MTTR is especially valuable when output loss is the main concern. If two packaging lines fail the same number of times per month, but one takes 35 minutes to restore, and the other takes 95 minutes, the second line creates far more schedule disruption, even with the same failure count. In that case, the priority is not reliability engineering first, but faster recovery.
MTBF: How Often Repairable Equipment Fails
MTBF, or mean time between failures, looks at the operating time between one failure and the next on assets that can be repaired and returned to service. Where MTTR focuses on recovery speed, MTBF focuses on reliability そして failure frequency. A high MTBF generally means the equipment runs longer before breaking down again.
This metric is most useful for reliability engineers, maintenance planners, and plant managers deciding where to focus preventive action. If a conveyor has a low MTTR but also a very low MTBF, your technicians may be fixing it quickly, but the asset is still failing too often. In that situation, a good MTTR calculation does not mean the equipment is healthy; it only means the team is efficient at restoration.
MTTF: When the Asset or Component Is Not Repaired
MTTF, or mean time to failure, is used for items that are typically replaced rather than repaired. This often applies to components such as sensors, fuses, and bearings in certain maintenance strategies, or low-cost electronic modules where replacement is faster and more practical than repair. The metric estimates how long the item operates before it fails.
For production leaders, MTTF is less about daily breakdown response and more about lifecycle planning, spares strategy, and supplier evaluation. If a photoelectric sensor model has a much shorter MTTF than expected, the issue is not how fast the team responds after failure, but whether the component choice, environment, or installation standard is wrong. That makes MTTF useful in different decisions than those supported by MTTR.
Maintenance Response Time: How Fast Work Starts
Maintenance response time measures the delay between fault reporting and the beginning of maintenance action. This is related to MTTR, but it is not the same thing. If your plant tracks response time separately, you can see whether slow restoration comes from delayed dispatch or from lengthy diagnosis and repair after a technician arrives.
This distinction matters because the corrective action is different. A poor response time may point to weak escalation rules, unclear ownership, or late reporting from production, while a poor mean time to repair may point to technical complexity, spare shortages, or restart testing issues. For supervisors managing multiple lines, separating the two prevents vague conclusions like “maintenance is too slow” when the real delay starts before repair work even begins.
Equipment Downtime Tracking: The Data Layer Behind All Four
None of these metrics is trustworthy without disciplined equipment downtime tracking. You need consistent failure codes, start and end timestamps, asset IDs, and clear event classification so the same stoppage is not counted differently by different shifts. Even small timestamp errors can distort MTTR, MTBF, and response-time trends, especially in plants with frequent short stops.
For plant managers, downtime records help connect maintenance metrics to business impact, such as lost output, overtime, and missed delivery windows. For reliability engineers, the same records support failure pattern analysis and recurring cause identification. For production managers, they make it easier to distinguish a chronic equipment issue from a reporting problem or scheduling issue.
Which Metric Should You Use for Which Decision?
If your question is, “How quickly are we getting the line back up?”, use MTTR. If the question is, “Which assets fail too often?”, use MTBF. If the question is, “How long do these replaceable components last before failure?”, use MTTF, and if the question is, “How long does it take for maintenance to respond once a fault is raised?”, track maintenance response time separately.
In practice, the strongest maintenance reviews use these metrics together rather than in isolation. A line can have good MTBF and poor MTTR, poor MTBF and good MTTR, or acceptable repair speed but weak response time. If you want to reduce MTTR later, this comparison is what helps you first identify whether the problem is reliability, responsiveness, repair execution, or poor data capture.
Why Manufacturing Teams Struggle With High MTTR
Delays Often Start Before Repair Work Begins
高い MTTR is often blamed on technician speed, but on most factory floors, the bigger issue is how slowly the repair process starts. A machine can be down for 20 minutes before maintenance even gets a complete report, especially when operators rely on phone calls, paper notes, or verbal escalation. In that situation, the mean time to repair rises not because the fix is technically difficult, but because the workflow around the fix is weak. For plant leaders, that is an important part of MTTR, meaning in practice: it reflects process discipline as much as maintenance capability.
A typical breakdown-to-restart sequence has several bottlenecks: the operator notices the fault, reports it, waits for acknowledgment, maintenance diagnoses the issue, parts are checked, the repair is done, and the asset is tested before restart. If any step is undocumented or owned by “whoever is available,” repair time stretches quickly. This is why MTTR calculation can look worse than expected even when wrench time is only a small portion of total downtime. The problem is often not the repair itself, but the gaps between steps.
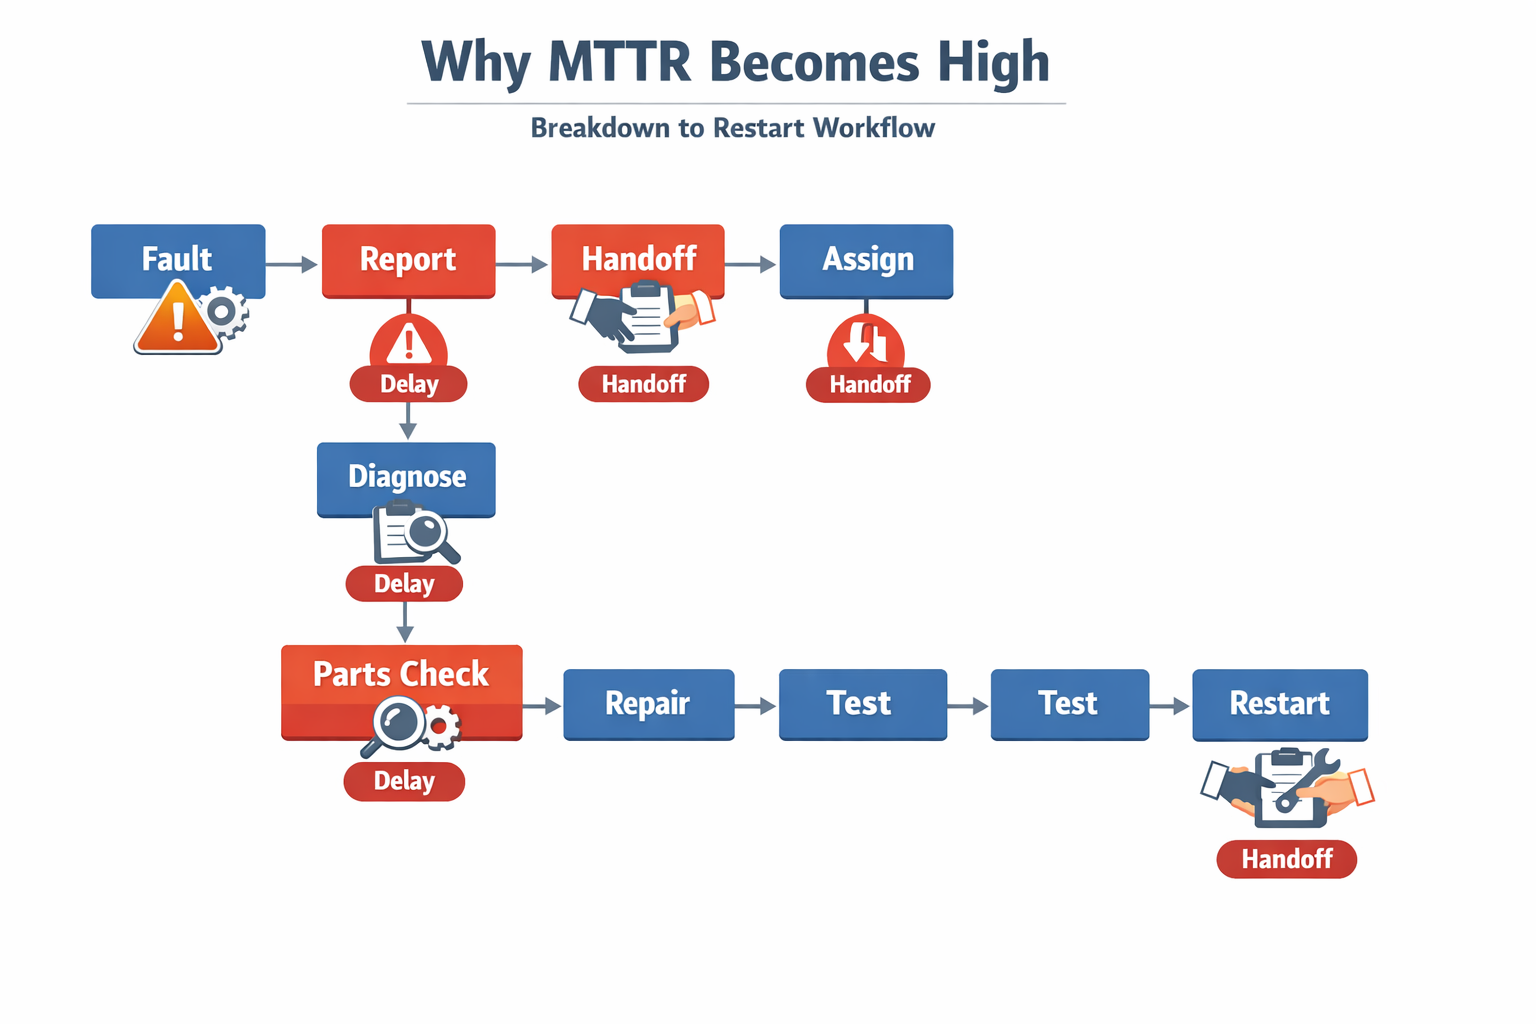
Unclear Ownership Slows Decisions
When no one clearly owns the next action, downtime expands minute by minute. In an automotive stamping line, for example, operators may report a press fault to a shift supervisor, who then tries to locate a maintenance technician, while production control waits for an update before rescheduling work. Each handoff adds delay, and no one has a single timestamped record of when the issue was reported, assigned, or resolved. That makes equipment downtime tracking incomplete and pushes the true mean time to repair higher.
Ownership problems also distort improvement efforts. If maintenance believes the response was fast but production believes support arrived late, teams end up debating anecdotes instead of fixing root causes. Without clear assignment rules, it is difficult to separate maintenance response time from actual repair execution. That weakens both MTTR formula accuracy and accountability.
Incomplete Work Orders Create Rework
Many repairs start with poor information: “machine stopped,” “alarm on,” or “not running properly.” That forces technicians to spend extra time finding the exact asset, confirming the fault mode, and checking what happened before the stop. In an electronics assembly plant, a surface-mount line fault reported without board type, feeder station, or alarm code can turn a short intervention into a long diagnostic exercise. The result is a higher MTTR, not because the team lacks skill, but because the work order lacks context.
Incomplete records also make repeat failures harder to analyze later. If failure symptoms, actions taken, and restart confirmation are captured inconsistently, the next technician starts from zero. Over time, weak data quality damages both daily execution and longer-term MTTR calculation. Teams cannot reduce MTTR reliably when every breakdown is documented differently.
Spare Parts Visibility Is Often the Hidden Constraint
A repair can be diagnosed correctly and still take too long because no one knows whether the needed spare is available. In many plants, parts data lives in separate spreadsheets, storerooms, or the memory of one experienced storekeeper. Technicians lose time walking to the crib, making calls, or checking substitute parts manually. That delay is rarely visible in reports, but it directly increases mean time to repair.
This is especially common in food and beverage plants, where packaging equipment may rely on small but critical consumables, sensors, or change parts. If the team discovers only after diagnosis that the required item is out of stock or stored in another area, the repair clock keeps running. For operations managers, this is where equipment downtime tracking needs to connect repair records with parts availability, not treat them as separate issues.
Shift Handoffs and Downtime Logs Break Continuity
Repairs that cross shifts often suffer from weak handoffs. One team may identify a probable cause, but the next shift receives only a brief verbal update with no detailed status, no test results, and no record of parts already replaced. The incoming technician may repeat checks, reopen panels, or restart troubleshooting from scratch. That duplicate effort quietly adds hours to MTTR.
Poor downtime logs make the problem worse. If start times, pause times, test completion, and restart times are entered late or from memory, the MTTR calculation becomes unreliable. Teams then struggle to tell whether they have a repair-speed problem, a reporting problem, or both. Before manufacturers can reduce MTTR, they need a more disciplined way to capture what happened between breakdown and normal production.
How to Reduce MTTR With Digital Work Orders and Downtime Logs
Standardize the Repair Workflow First
If you want to reduce MTTR, start by making every breakdown follow the same process from report to restart. A standard digital work order should capture the asset ID, line, fault category, downtime start time, operator notes, assigned technician, repair actions, test results, and restart confirmation. This removes guesswork from the MTTR calculation and ensures your mean time to repair reflects the actual repair cycle, not incomplete paperwork.
標準化 matters because repair delays often come from missing information rather than repair complexity. In many plants, technicians still lose time calling supervisors for asset details, checking old spreadsheets, or clarifying whether the machine is already back in service. A digital work order closes those gaps by forcing the right data to be captured at the point of failure.
Build Timestamped Downtime Logs Into the Process
To make equipment downtime tracking useful, every major event in the repair cycle needs a timestamp. That usually includes fault reported, technician assigned, technician arrived, diagnosis completed, repair completed, test passed, and equipment released to production. With those timestamps in place, you can separate repair duration from maintenance response time and see exactly where MTTR is being extended.
This is where many spreadsheet-based systems fail. They may record the final downtime total, but they rarely capture the sequence of events consistently enough for reliable MTTR analysis. With Jodoo, manufacturers can build no-code downtime forms and linked work order workflows that automatically log each status change, creating a clean record for both auditability and faster MTTR calculation.
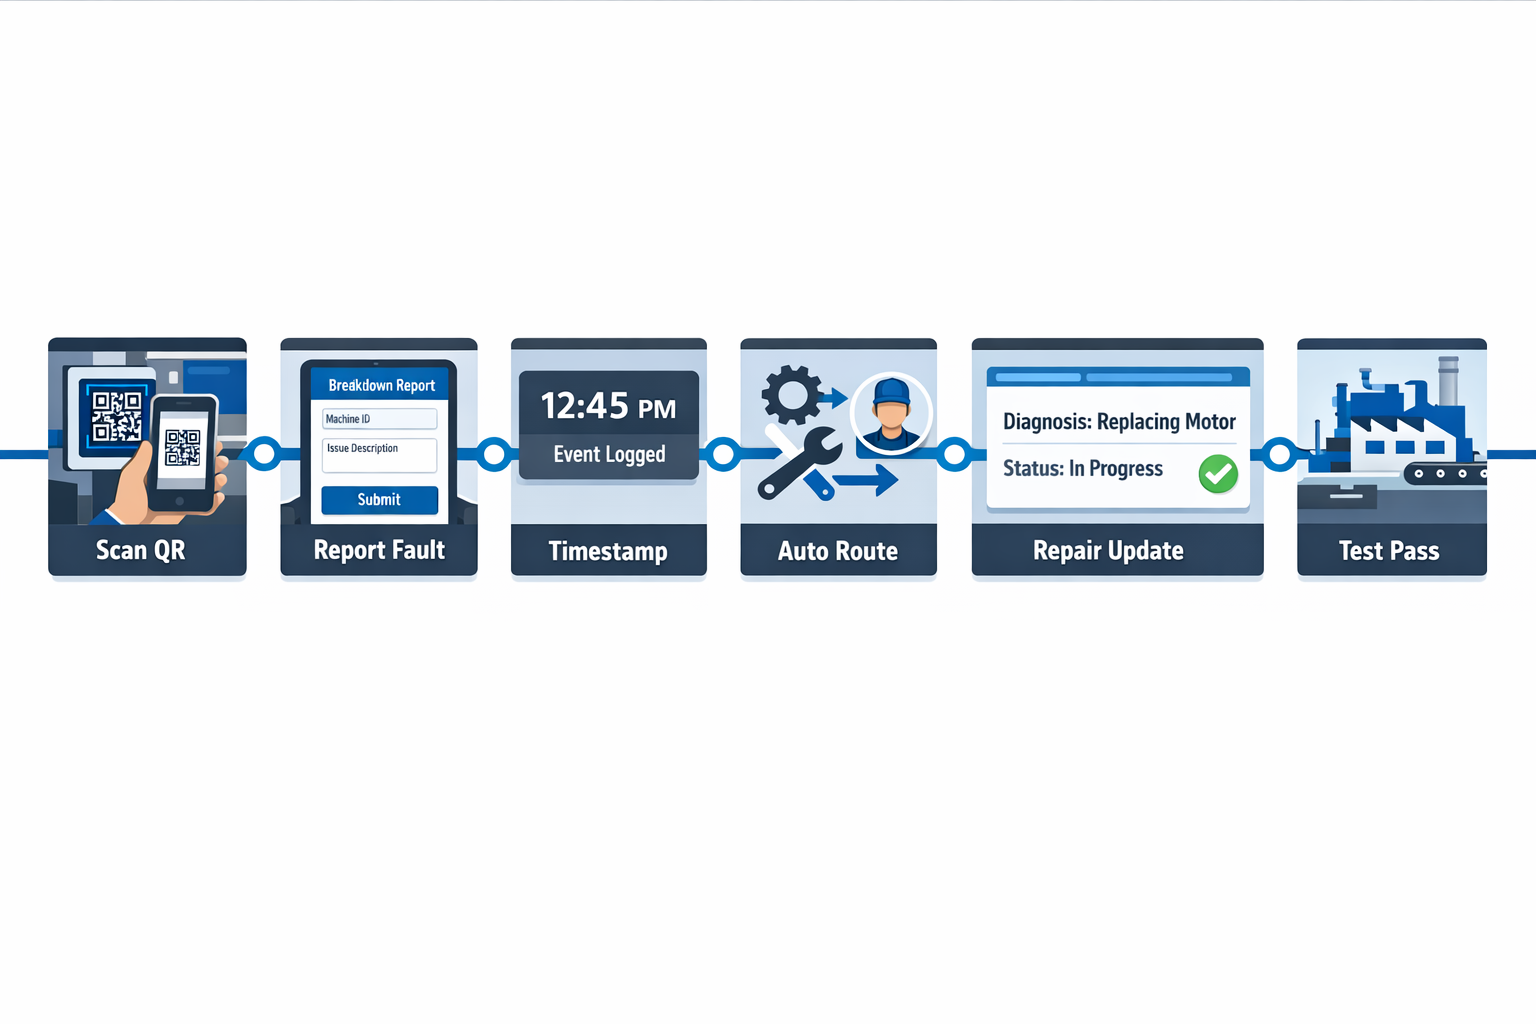
Use Automated Alerts and QR-Based Asset Identification
Once the workflow is standardized, the next step is to shorten the time between breakdown, assignment, and action. QR codes placed on each asset let operators scan the machine and open the correct breakdown form immediately, which reduces manual entry errors and avoids confusion over similar equipment names or line numbers. That is especially useful in larger plants where one delay at the reporting stage can add several minutes before maintenance even sees the issue.
Automated alerts then move the ticket to the right person without waiting for a phone call or shift leader handoff. In Jodoo, you can route breakdown tickets by production line, equipment type, severity, or shift, and trigger app, email, or message notifications to the assigned maintenance team. The result is a faster and more controlled workflow from fault report to work order acceptance to repair closure.
An effective end-to-end digital workflow typically looks like this: the operator scans the asset QR code, submits a fault report, the system timestamps the event, routes the ticket to the correct technician or supervisor, updates status through diagnosis and repair, and records the final restart time after testing. Because each step is logged in one system, your MTTR meaning becomes operationally useful rather than theoretical. Instead of asking why repair time was high last week, you can see whether the delay came from reporting, response, diagnosis, parts, or verification.
Track Response Time and Repair Time Separately
Plants often struggle to reduce MTTR because they treat all downtime as one number. In practice, the improvement actions are different if the delay comes from slow acknowledgment, long travel time, spare parts waiting, or difficult repair execution. A better system tracks maintenance response time and repair time separately, then connects both back to the full downtime event.
Jodoo makes that separation practical by linking forms, workflows, and status rules in one no-code app. You can define when the clock starts for response, when the repair stage begins, and when the asset is formally returned to operation, without forcing your team to maintain multiple disconnected files. That gives maintenance managers cleaner data for weekly review and gives production leaders a more credible basis for line-level downtime decisions.
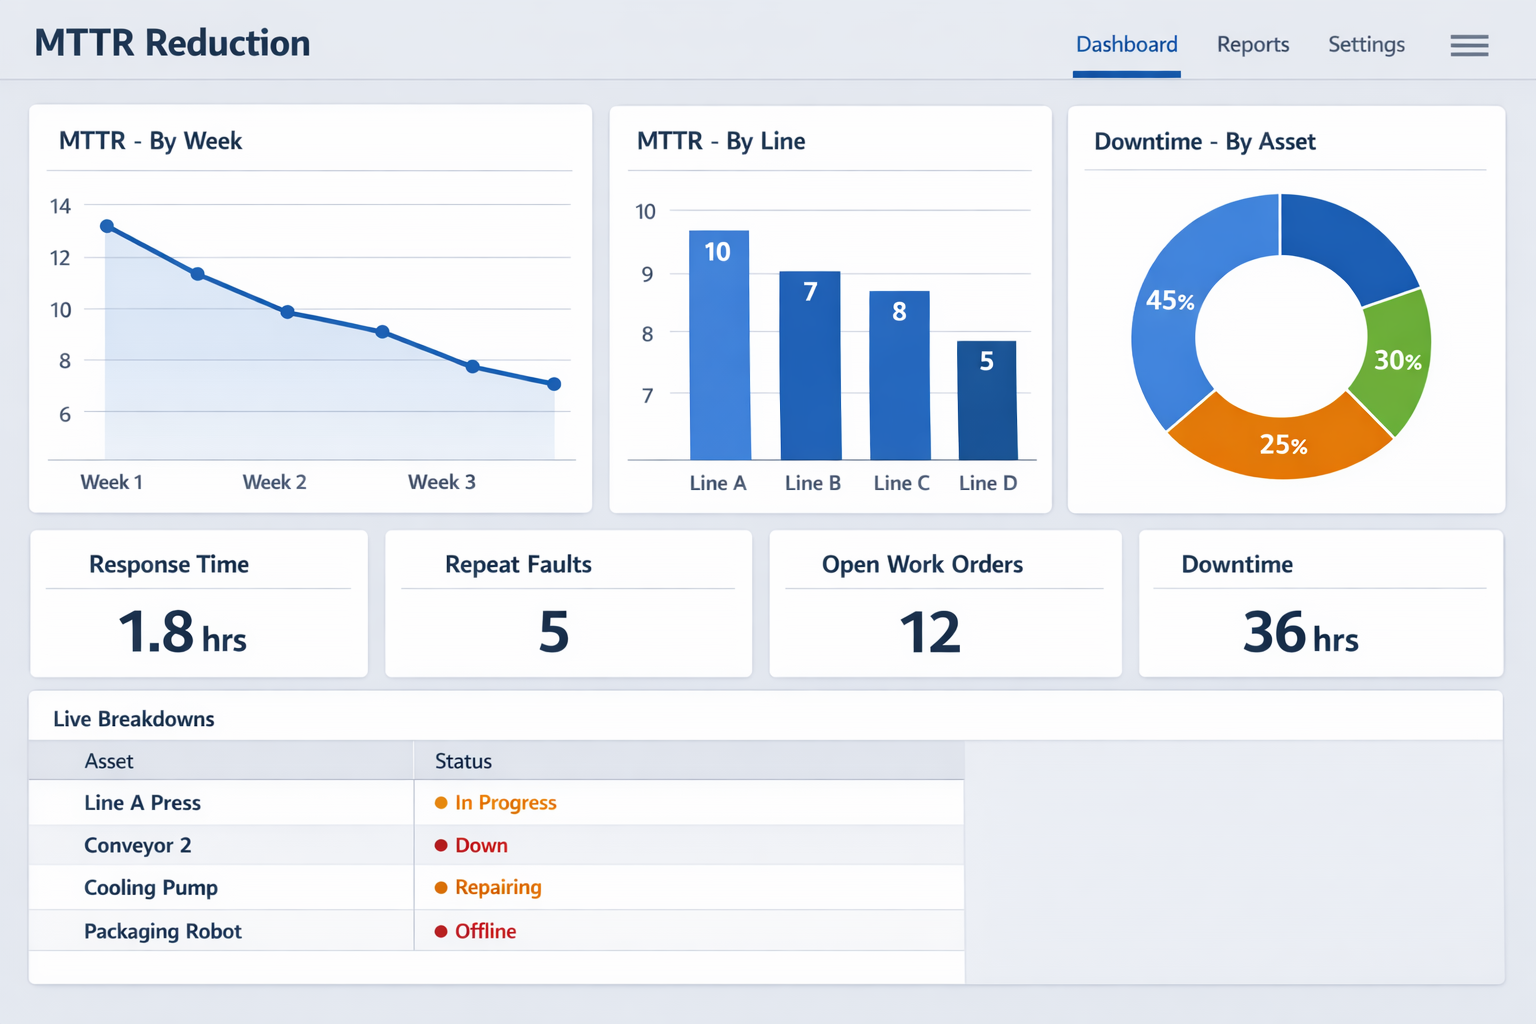
Turn MTTR Data Into Action With Dashboards
Once data capture is consistent, the next priority is visibility. A useful MTTR dashboard should show mean time to repair by line, asset, fault type, shift, and technician team, alongside counts of repeat failures and overdue work orders. This helps you spot whether a high MTTR number is driven by one unstable asset, one bottlenecked shift, or one recurring failure mode.
と Jodoo dashboards, maintenance and operations teams can monitor live breakdown status, response-time trends, and downtime by asset class without waiting for manual report consolidation. You can also set threshold-based alerts for abnormal MTTR by line or equipment group, which supports faster escalation when performance starts to drift. For plants running multiple lines or buildings, that visibility is often what turns equipment downtime tracking from recordkeeping into active control.
A Practical Example From an Electronics Plant
In one electronics assembly environment, breakdown tickets were previously reported through chat messages and updated later in spreadsheets. That created delays between the initial fault report, technician assignment, and repair closure, which made the MTTR formula look worse without clearly showing why. By using Jodoo to route tickets automatically by line and asset group, the plant created immediate assignment rules, standardized repair logs, and real-time dashboard tracking for open faults.
The improvement was not just faster data entry. The maintenance team could see where time was being lost inside the repair process, and supervisors no longer had to reconcile multiple records before reviewing MTTR performance.
Conclusion: Turn MTTR From a Formula Into a Continuous Improvement System
MTTR matters because it turns equipment downtime into something your team can measure, compare, and improve. But the number is only useful when everyone follows the same rules for when the repair clock starts and stops, what activities count, and how breakdown data is recorded. Without that discipline, MTTR becomes a reporting exercise instead of a decision-making tool.
For most manufacturers, a high mean time to repair is not caused by technician capability alone. It is usually the result of delayed fault reporting, incomplete work orders, poor spare-parts visibility, weak shift handovers, or inconsistent downtime logs. When you standardize repair workflows and capture timestamps consistently, MTTR becomes a practical KPI for reducing lost output, protecting labor efficiency, and improving delivery performance.
If you want to move from spreadsheet-based tracking to a more reliable system, Jodoo can help. As a no-code lean manufacturing platform, Jodoo lets you build digital maintenance forms, automated work order workflows, QR-based equipment tracking, and real-time dashboards without heavy custom development. You can 無料トライアルを開始する または デモを予約する to see how Jodoo can help your plants track repair time more accurately and reduce downtime faster.