Introduction: What MTBF Means for Equipment Reliability
Unplanned downtime is one of the fastest ways to lose output, overtime capacity, and delivery confidence. In many factories, a single critical machine stoppage can ripple across the entire line, especially in high-volume environments where every lost minute affects schedule attainment. That is why MTBF (Mean Time Between Failures) matters: it gives you a practical way to measure how reliably repairable equipment runs before it breaks down again.
MTBF tells you the average operating time between one failure and the next. For maintenance managers, reliability engineers, and plant leaders, it is a decision-making metric that helps you spot weak assets, compare reliability trends over time, and prioritize maintenance effort where it will reduce unplanned stops the most.
In the sections that follow, we will break down the MTBF formula, show how the MTBF calculation works with real operating data, and explain how to interpret the number. You will also see how MTBF relates to broader maintenance performance and how better preventive maintenance and machine failure tracking can improve equipment reliability in a measurable way.
MTBF Explained: Definition, Scope, and When to Use It
What Mean Time Between Failures Actually Measures
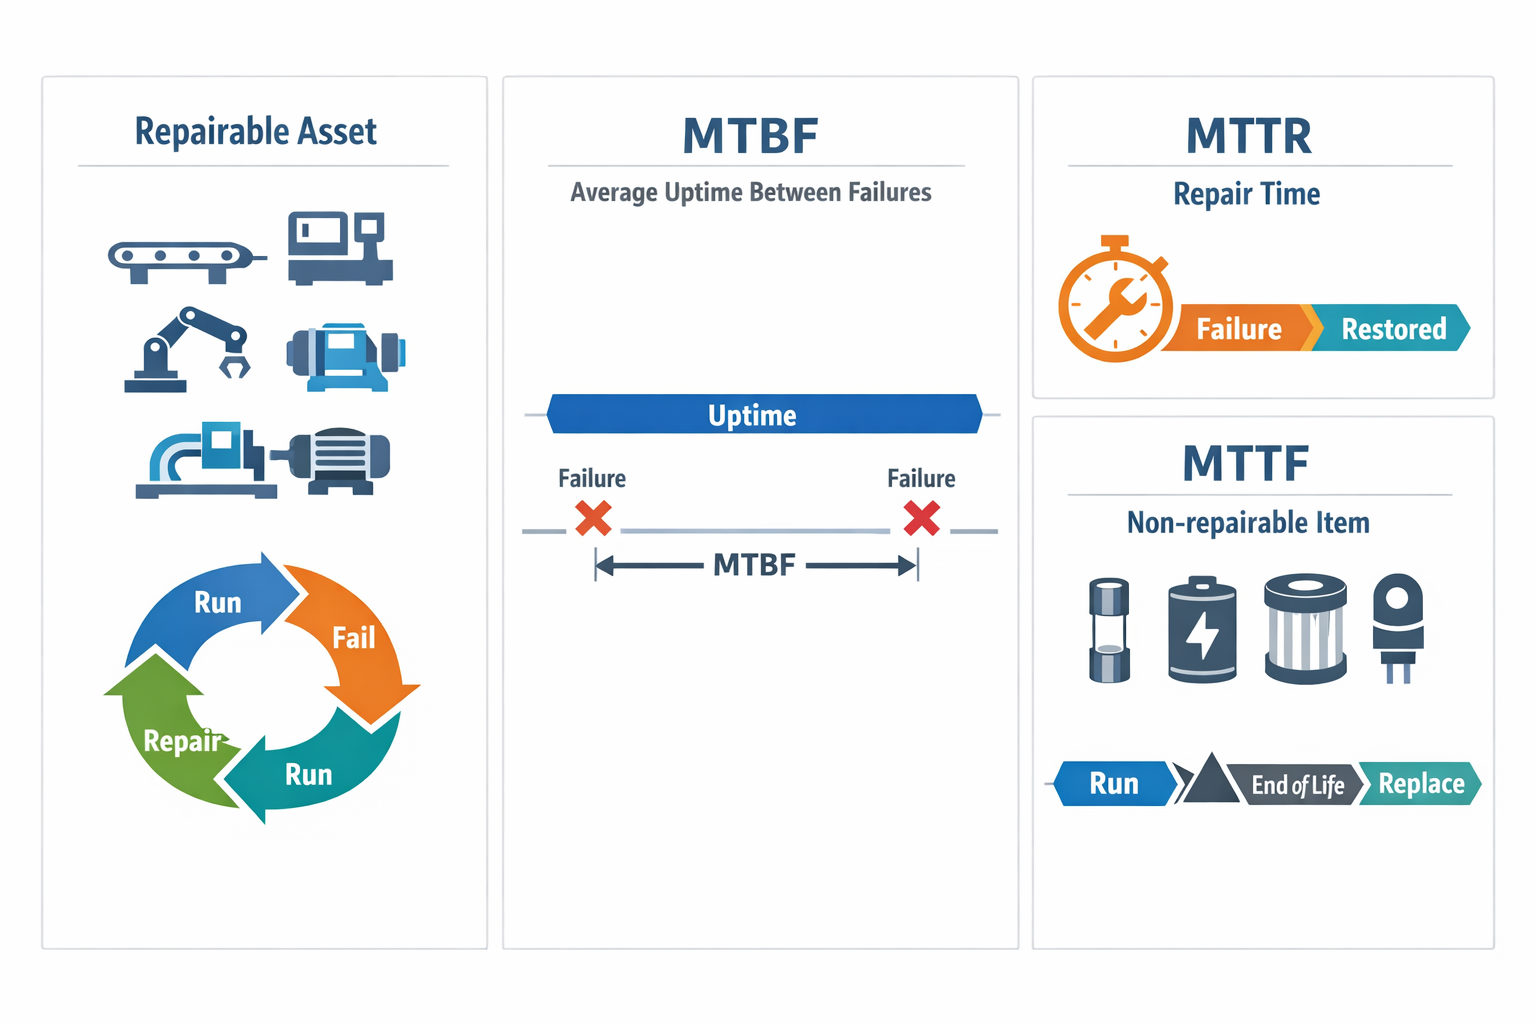
MTBF measures the average operating time a repairable asset runs before it fails and must be restored to service. In practice, it is an equipment reliability metric used for assets such as CNC machines, conveyors, filling machines, compressors, and SMT placement equipment. It does not tell you how long a machine will last forever; it tells you how often breakdown events occur across a given operating period.
That distinction matters because MTBF is about failure intervals, not total asset life. A machining center in an automotive cell may fail, get repaired, and return to production several times in a quarter, making MTBF useful for trend analysis. By contrast, if a part is thrown away when it fails rather than repaired, MTBF is usually not the right metric.
MTBF Applies to Repairable Assets
MTBF should be used for assets that are expected to operate, fail, be repaired, and then operate again. Typical examples include a robotic welding station, a reflow oven on an electronics line, or a pump in a food processing system. These assets can experience repeated failure events, which makes the mean time between failures a practical way to evaluate reliability over time.
을 위한 non-repairable items, teams usually use MTTF instead of MTBF. A sensor battery, fuse, cutting insert, filter cartridge, or other consumable component is replaced when it reaches the end of its life rather than being repaired and returned to service. Mixing repairable and non-repairable items in the same MTBF calculation creates misleading reliability data and weakens maintenance decisions.
What Counts as a Failure
A failure for MTBF purposes is any event that causes the asset to lose its intended function and requires corrective action before normal operation can resume. In an automotive machining cell, that might be a spindle fault that stops the station. On an electronics assembly line, it could be a feeder control failure that halts component placement. In a food processing line, a pump seal failure that interrupts product flow would usually count as a failure.
The key is 일관성. If one shift logs only complete stoppages and another logs both stoppages and severe speed-loss events, your MTBF calculation will not be comparable across time or lines. Plants need a clear rule for whether minor faults, temporary resets, and degraded-performance events are counted as failures or tracked separately through machine failure tracking standards.
What Counts as Operating Time
Operating time is the period when the asset is actually available for production and expected to run. This usually excludes planned shutdowns such as scheduled maintenance, holiday closures, product changeovers, and other approved non-production windows. If you include planned downtime in the denominator, the resulting mean time between failures will look better than the machine’s real performance.
The exact rule should match the production environment. For example, an SMT line running two shifts should calculate operating time differently from a 24/7 beverage filling line. The goal is not to make the number bigger, but to make it accurate enough to support reliability analysis later.
When MTBF Is Most Useful
MTBF is most useful when you are evaluating recurring breakdown behavior on critical production assets. It works well for comparing the same machine over different months, identifying weak equipment within a line, and checking whether preventive maintenance changes are reducing failure frequency. It is less useful for one-off failures, rarely used spare equipment, or disposable parts with no repair cycle.
Used correctly, MTBF gives maintenance and operations teams a shared language for reliability. It helps you move from anecdotal statements like “this machine is always down” to a measurable pattern based on operating hours and repeat failures. The next step is making sure the number is calculated correctly from real operating data, which is where the formula and input rules matter most.
The MTBF Formula and How to Calculate It Correctly
The Basic MTBF Formula
그만큼 MTBF 공식은 간단합니다. total operating time ÷ number of failures. In practice, the difficult part is not the math but deciding what counts as operating time and what should be logged as a failure. If those inputs are inconsistent, your MTBF calculation becomes unreliable and stops being a useful equipment reliability metric.
For most production assets, you should use actual running time during the selected period, not calendar time. That means excluding planned shutdowns such as public holidays, scheduled changeovers, preventive maintenance windows, and approved line cleaning stops. The goal is to measure how long the equipment operated between unplanned failures, not how long it existed on the shop floor.
A Step-by-Step MTBF Calculation Example
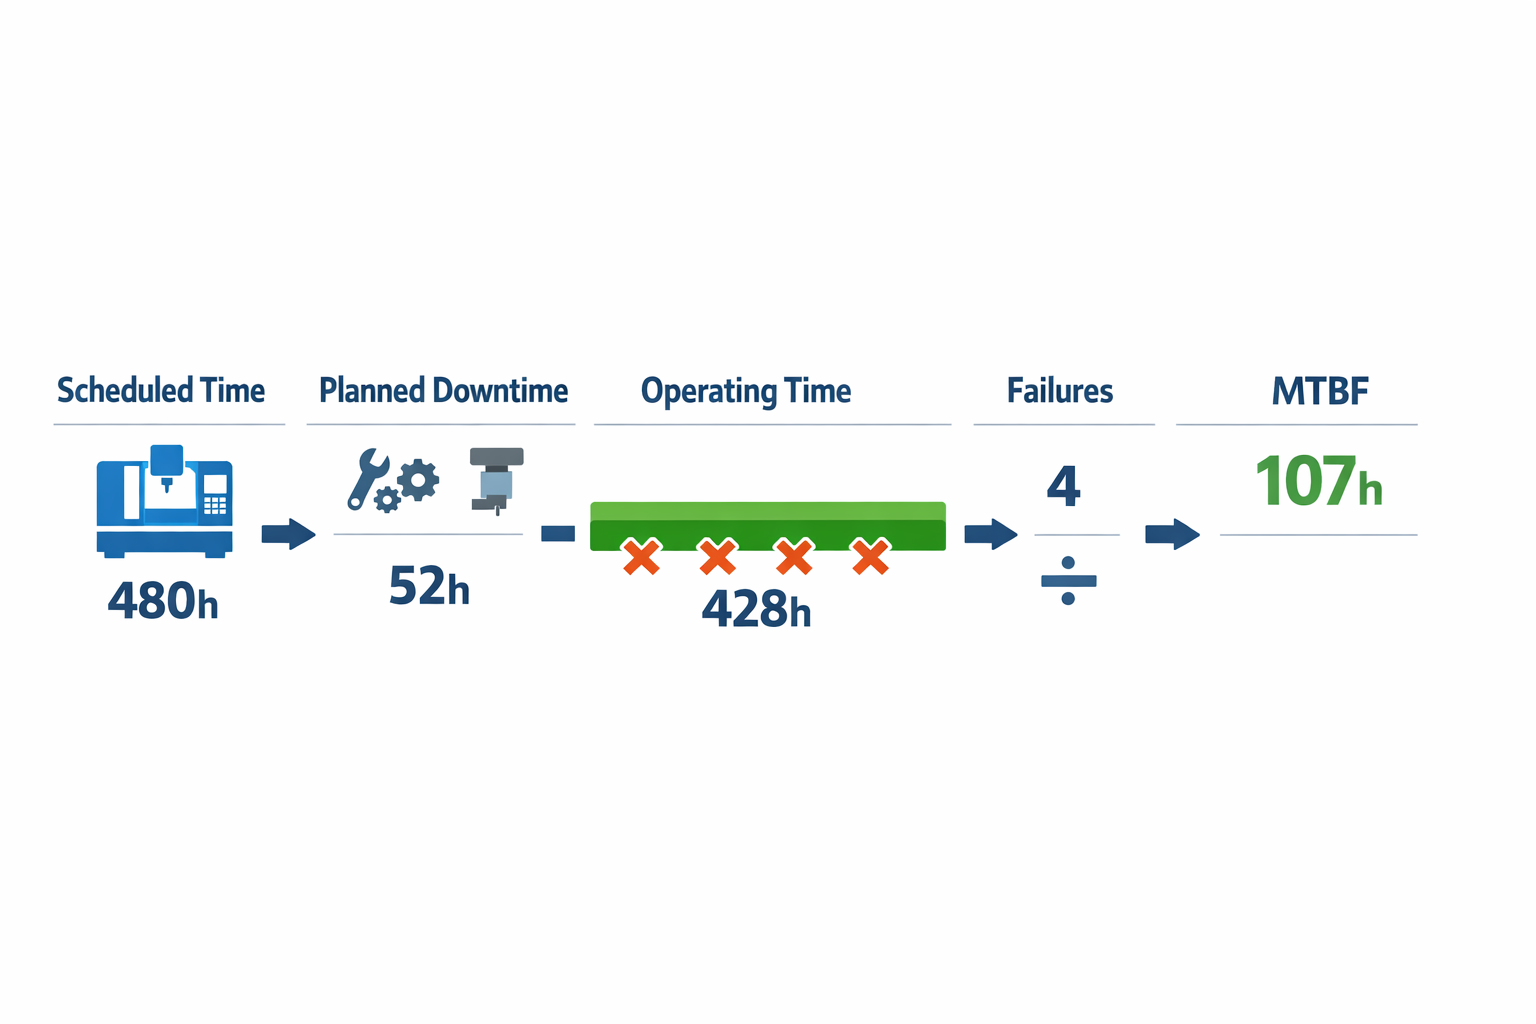
Take a CNC machining center in a metal components plant over a 30-day reporting period. During that month, the machine was scheduled for 480 hours, but 52 hours were planned downtime for weekend shutdowns, tool change programs, and preventive maintenance. That leaves 428 operating hours to use in the MTBF calculation.
Now assume the maintenance log shows 4 unplanned failures during those 428 hours. The failures were a spindle drive fault, a coolant pump trip, a tool magazine sensor failure, and a lubrication pressure alarm that stopped production and required repair. The MTBF calculation is: 428 hours ÷ 4 failures = 107 hours.
You can lay it out like this: scheduled time = 480 hours, less planned downtime = 52 hours, giving operating time = 428 hours; then divide by 4 failure events to get an MTBF of 107 hours. This means the machine ran, on average, 107 operating hours between failures during that month. That number is much more useful than a rough estimate pulled from memory or from incomplete spreadsheet notes.
Input Decisions That Change the Result
One common mistake is counting every disturbance as a failure. If the machine slows down for three minutes because an operator clears chips without maintenance intervention, many plants would log that as a minor stop, not a failure. But if the same event triggers an alarm, stops the machine, and requires technician action, it should usually be counted in machine failure tracking.
Partial failures also need a rule. If the machine keeps running at reduced speed because one subsystem is unstable, you need to decide in advance whether that event qualifies as a failure for MTBF purposes. The best approach is to use a written standard tied to production impact, such as any event that causes an unplanned stop longer than 10 minutes or requires maintenance.
그만큼 reporting period matters as well. A one-week sample may be too short for low-failure critical assets, while a full year can hide recent deterioration after a process change or shift in operating load. Many plants start with monthly MTBF tracking for day-to-day control and review quarterly trends to confirm whether reliability is truly improving.
How to Keep the Calculation Credible
If you want a dependable mean time between failures figure, use the same rules every month across shifts and production lines. Standardize failure codes, operating-time logic, and downtime categories before you build reports. That discipline makes later decisions on preventive maintenance and reliability improvement far more defensible.
How to Interpret MTBF Alongside MTTR, MTTF, and Maintenance Performance
MTBF Is Useful Only in Context
A higher mean time between failures usually points to better reliability, but the number means little without context. A CNC spindle running 20 hours per day under heavy load will have a very different baseline from a low-duty conveyor motor used only during changeovers. The same equipment reliability metric can also shift after process changes, operator turnover, or a deferred maintenance period, even when the asset itself has not changed. That is why MTBF should be reviewed with asset criticality, duty cycle, 그리고 maintenance history in mind.
There is also no universal benchmark for a “good” MTBF. In high-speed packaging, an MTBF of 120 hours may be unacceptable if failures stop a full line, while in a utility support system, that same number may be manageable if redundancy is built in. Industry studies often show that unplanned downtime can cost manufacturers thousands of dollars per hour, so the right target is usually economic as much as technical. In practice, you should compare MTBF against your own historical trend, similar assets, and the production impact of each failure.
How MTBF Compares with MTTR and MTTF
MTBF tells you how long repairable equipment typically runs between failures, while MTTR tells you how long it takes to restore that equipment once a failure happens. MTTF, by contrast, is used for non-repairable items and estimates the time to failure over a component’s usable life. If you only track the MTBF calculation, you may conclude an asset is reliable even when recovery time is so long that production performance still suffers. Looking at the three together gives a more complete view of reliability, maintainability, and replacement planning.
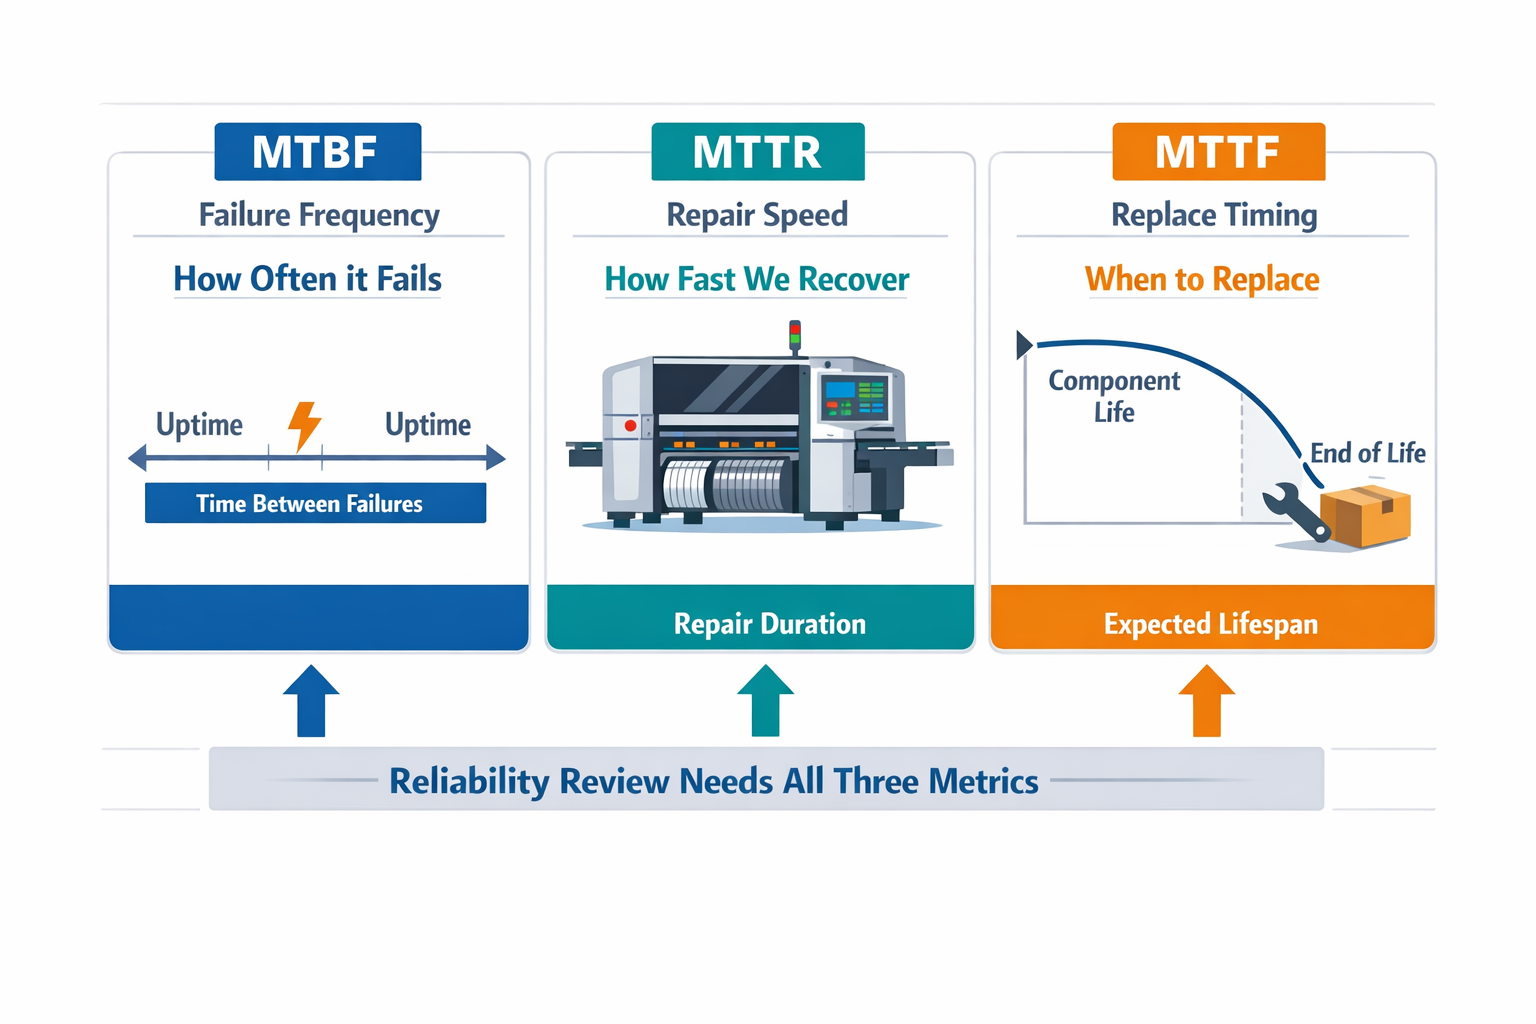
For example, an electronics assembly placement machine may post a decent MTBF, but if each feeder-related failure takes 90 minutes to correct, output loss can still be severe. On the other hand, a short MTTR can partly offset a lower MTBF when failures are minor, predictable, and quickly contained. This is why reliability reviews should not treat MTBF as a standalone score.
What MTBF Can Tell You About Maintenance Performance
Used correctly, MTBF is a strong indicator of whether your maintenance strategy is preventing repeat breakdowns. If MTBF rises after lubrication intervals are tightened or inspection points are revised, that suggests your actions are removing failure causes rather than just reacting to symptoms. If MTBF stays flat while maintenance hours increase, you may be spending more effort without addressing the actual failure mode. In that sense, MTBF is not just a formula result; it is a feedback loop for maintenance effectiveness.
It is also helpful at the line-review level because it connects technical reliability with operational performance. A food filling line with stable output but falling MTBF may be compensating through fast interventions, overtime, or operator workarounds, which is not sustainable. By flagging that trend early, maintenance and production can review whether settings drift, wear parts, or cleaning routines are driving recurring stops. This makes MTBF a practical bridge between machine data and daily operations decisions.
How to Use MTBF in Planning and Review Cycles
MTBF should inform preventive maintenance timing, but not dictate it mechanically. If a pump’s average time between failures is 1,800 operating hours, that does not mean you wait until 1,799 hours to inspect it. Instead, you use the trend together with failure mode severity, operating conditions, and OEM guidance to decide whether inspections, condition checks, or component replacement should happen earlier. The goal is to prevent avoidable breakdowns, not simply react to the average.
The same logic applies to spare-parts planning. Assets with low MTBF and long replenishment lead times need tighter stocking policies than assets with rare failures and fast local supply. During monthly performance reviews, many plants get more value by pairing MTBF with downtime minutes, MTTR, and top failure codes than by tracking the number alone. That approach keeps machine failure tracking tied to decisions on maintenance intervals, critical spares, and line-priority actions rather than turning MTBF into a passive dashboard metric.
How to Improve MTBF with Better Failure Tracking and Preventive Maintenance
Improving MTBF starts with better inputs, not better spreadsheets. In many plants, the mean time between failures looks worse or better than reality because breakdown records are incomplete, failure codes are inconsistent, or operators and technicians log the same event differently. If your MTBF calculation is based on weak event data, the number becomes a rough estimate rather than a reliable equipment reliability metric. That is why machine failure tracking and preventive maintenance have to improve together.
Why MTBF Data Is Often Wrong in Real Plants
A common problem is that teams do not use one clear definition of failure across shifts. On a packaging line, for example, one operator may log a film jam as a minor stop while another logs it as a breakdown, even when both events stop production for 15 minutes. That inconsistency distorts mean time between failures, especially on assets with frequent short stops. Over a month, small classification errors can shift the MTBF formula outcome enough to send maintenance teams toward the wrong priorities.
The second issue is fragmented recordkeeping. In process manufacturing and packaging operations, failure history is often split across paper logs, maintenance spreadsheets, WhatsApp messages, and ERP notes. When records live in separate places, planners cannot reliably connect failure events to root causes, replaced parts, or overdue inspections. The result is an MTBF calculation that shows symptoms but not the maintenance actions needed to improve it.
Build One Failure Language Across the Line
To improve MTBF, start by standardizing what gets recorded every time a failure occurs. At minimum, each event should capture the asset ID, failure start time, restore time, symptom, failure mode, suspected cause, action taken, and whether the event caused a full or partial production stop. This gives you usable data for both reliability analysis and preventive maintenance planning. It also makes failure trends visible at the component level instead of burying everything under generic labels like “machine issue.”
A good practice is to create a short, controlled list of failure modes for each critical asset group. On a pouch filling and sealing line, that may include sealing jaw temperature fault, film tracking error, sensor contamination, pneumatic pressure loss, and conveyor motor overload. Once technicians and operators choose from the same list, repeat failures become easier to spot and compare across shifts. That is where MTBF starts becoming actionable rather than just reportable.
Tighten Inspection Routines Before Failures Repeat
Better inspection routines improve MTBF when they are targeted at known failure patterns, not just calendar-based tasks. If the pouch line has repeated photoelectric sensor contamination every 9 to 12 days, the right response may be a quick daily cleaning check and weekly alignment verification rather than waiting for the next stop. Short, focused checks often remove avoidable breakdown causes at far lower cost than reactive repairs. In many plants, these small routine controls deliver faster MTBF gains than major equipment overhauls.
Inspection quality also matters as much as inspection frequency. If technicians cannot record abnormal heat, vibration, contamination, wear, or looseness in a structured way, the preventive maintenance program stays subjective. Standard inspection criteria, photo capture, and pass/fail thresholds help teams detect deterioration before it becomes a logged failure. That makes your machine failure tracking more predictive and your MTBF trend more stable over time.
Turn Failure History Into Preventive Action
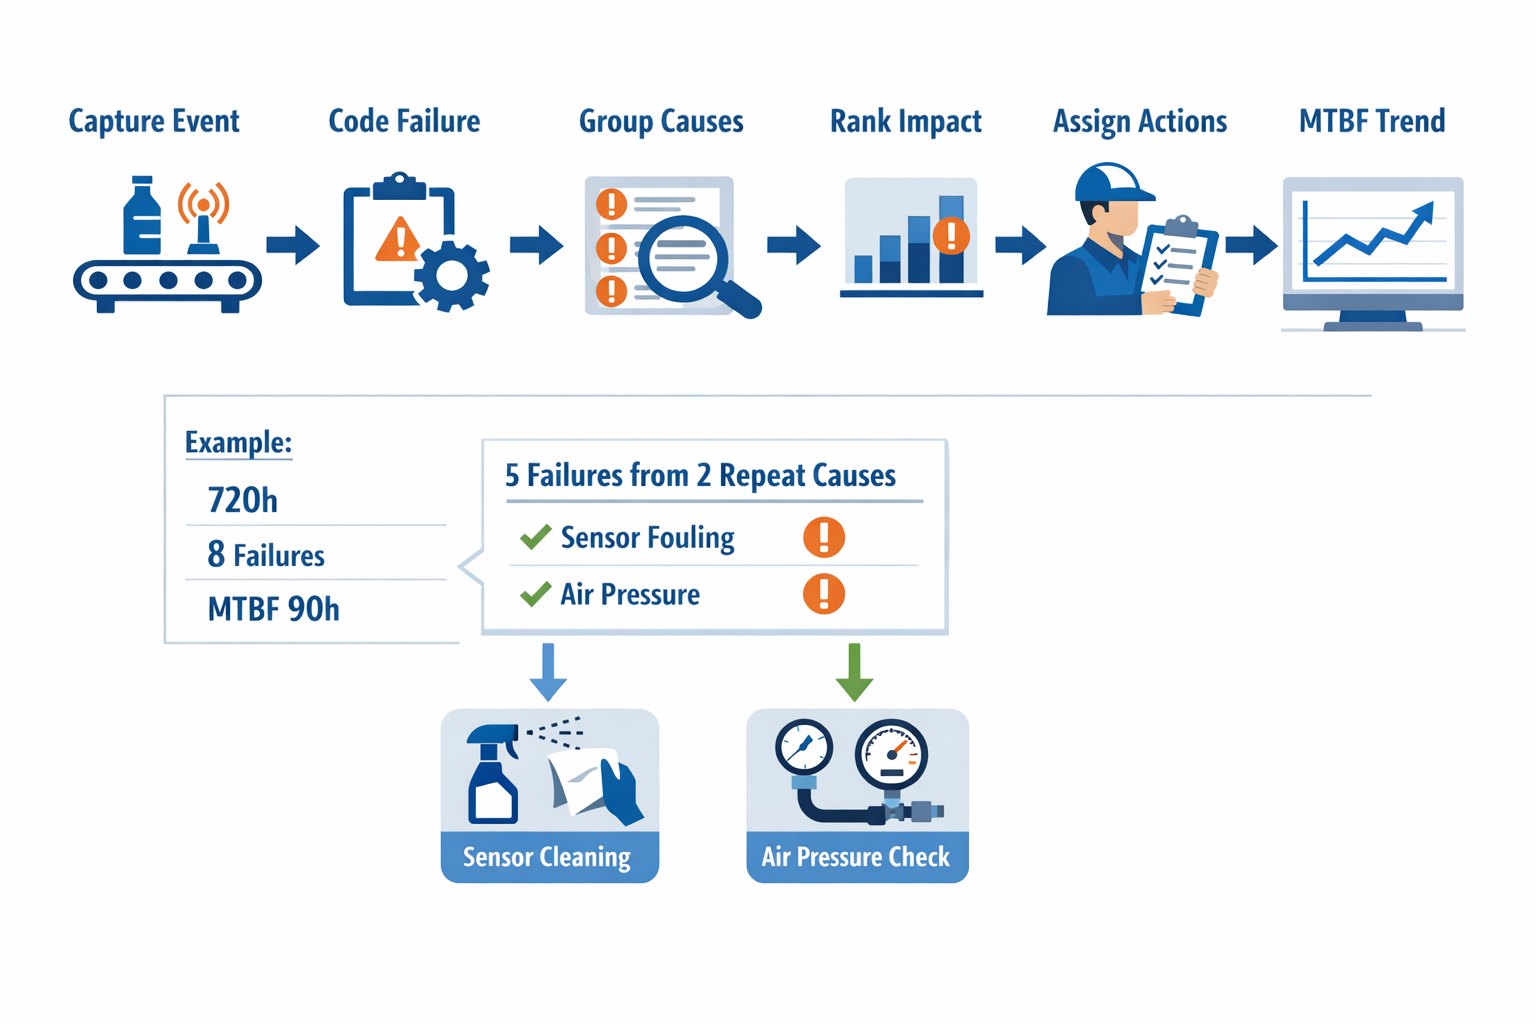
Consider a packaging line that ran 720 operating hours in a month and recorded 8 failures, giving an MTBF calculation of 90 hours. After the maintenance team cleaned up the event logs, they found that 5 of the 8 failures came from just two repeat causes: sensor fouling near the infeed and inconsistent air pressure to the sealing unit. Without that detail, the line simply looked unreliable. With it, the team could redesign the preventive maintenance plan around the actual loss points.
The workflow should be simple: capture each failure event in real time, review and code it consistently, group recurring events by mode and cause, rank them by downtime impact and frequency, then assign preventive actions with owners and due dates. On the same packaging line, this might mean adding a per-shift sensor cleaning task, installing an air pressure check at startup, and replacing a low-cost regulator before it fails again. Within two or three reporting cycles, you can see whether those actions are moving the mean time between failures in the right direction.
Focus on Repeatable Causes, Not One-Off Events
Not every breakdown deserves the same response. A single motor trip after a power disturbance should not drive the same preventive maintenance decision as a recurring seal temperature alarm that appears every week. The most effective MTBF improvement programs separate isolated incidents from repeatable failure modes, then concentrate labor and spare-parts planning on the repeat offenders. This prevents maintenance teams from spending too much time reacting to noise in the data.
A useful review rhythm is weekly for critical assets and monthly for broader line performance. In the weekly review, supervisors can check whether repeat failure modes are increasing, whether inspections were completed on time, and whether recent maintenance actions actually reduced recurrence. In the monthly review, managers can compare MTBF trends against production load, changeover intensity, and maintenance compliance. That keeps the equipment reliability metric tied to operating reality instead of treating it as an isolated KPI.
Conclusion: Turn MTBF Data into Action with Jodoo
MTBF only becomes valuable when your team uses it as an operating tool, not just a reporting metric. If failure data is incomplete, downtime categories are inconsistent, or calculations live in separate spreadsheets, even a well-known KPI like mean time between failures can lead to weak maintenance decisions. The real goal is simple: capture failure events accurately, calculate MTBF consistently, and act early enough to prevent repeat breakdowns, lost production time, and avoidable maintenance costs.
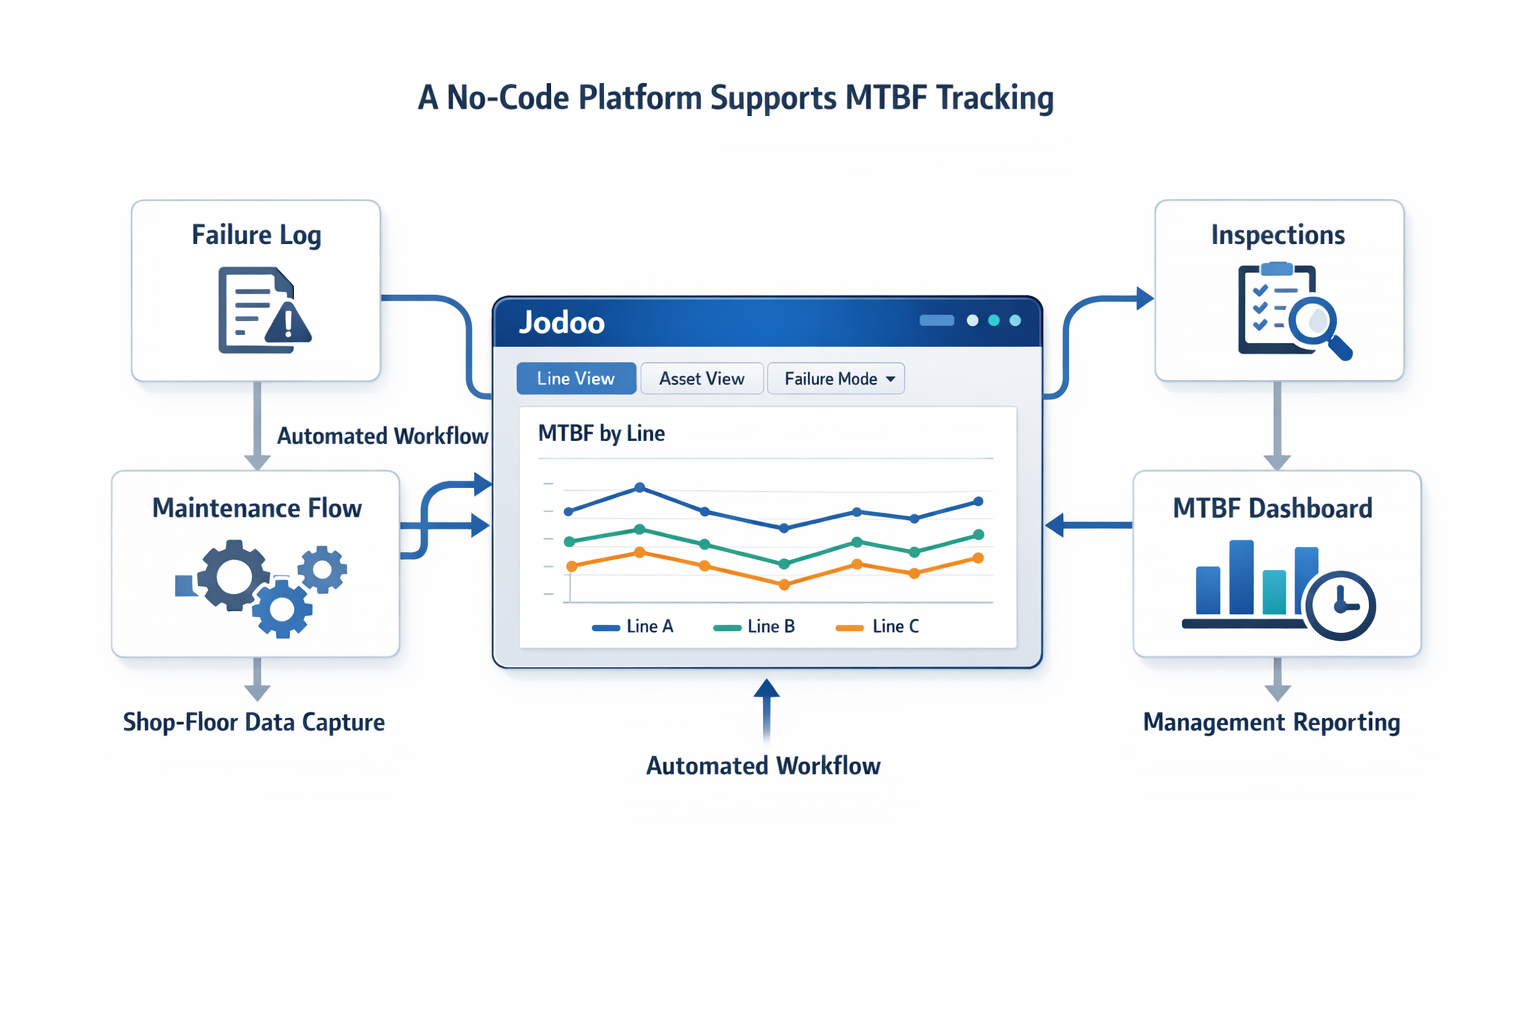
Jodoo helps manufacturers do that without waiting for a full CMMS rollout. As a no-code lean manufacturing platform, it lets your team build digital failure logging forms, maintenance workflows, inspection checklists, and live reliability dashboards that fit your actual shop-floor process. Instead of chasing paper records or merging files at month-end, you can connect forms, workflows, and dashboards into one system for faster root-cause follow-up and clearer MTBF visibility.
If you want to standardize reliability tracking quickly, you can 무료 체험을 시작하세요 또는 데모 예약하기 Jodoo가 귀사의 운영에 어떻게 적합한지 확인해 보세요.