Introduction: OEE Meaning and Why It Matters on the Factory Floor
A line can look busy all shift and still deliver disappointing output. In many factories, the gap comes from small stops, slow cycles, and quality losses that add up hour by hour. Overall equipment effectiveness (OEE) is one of the clearest ways to measure how well your equipment turns planned production time into good parts.
For plant managers, production managers, maintenance leaders, and lean teams, OEE is not just a KPI for reports. It shows whether a machine was available when it should have been running, whether it ran at the right speed, and whether it produced acceptable output. In practical terms, it helps you separate lost time caused by breakdowns, performance losses caused by reduced speed, and quality losses caused by scrap or rework.
This article answers the questions that matter on the shop floor: what OEE actually measures, how the OEE formula works, how to calculate it correctly, and what data you need to track it reliably. Whether you run automotive, electronics, food and beverage, packaging, or general manufacturing operations, accurate OEE tracking gives you a more realistic view of factory performance and a stronger basis for improvement.
What Overall Equipment Effectiveness Actually Measures
OEE is widely used as an equipment performance metric in manufacturing. It measures how much of your planned production time turns into fully productive time. In practical terms, it asks a direct question: during the time a machine was scheduled to run, how much of that time did it produce good parts at the expected speed?
Just as important, OEE does ~ 아니다 measure everything happening in the factory. It does not directly capture labor efficiency, material shortages outside the defined production window, schedule adherence, energy use, or upstream planning errors unless those issues show up as stoppages, speed loss, or quality loss during planned production time.
The three core factors in the OEE formula are availability rate, performance rate, 그리고 quality rate. Each one reflects a different category of production loss, and together they show whether the equipment was running at the right speed and producing good output. Combined, they create one equipment performance metric that is much more useful than uptime alone.
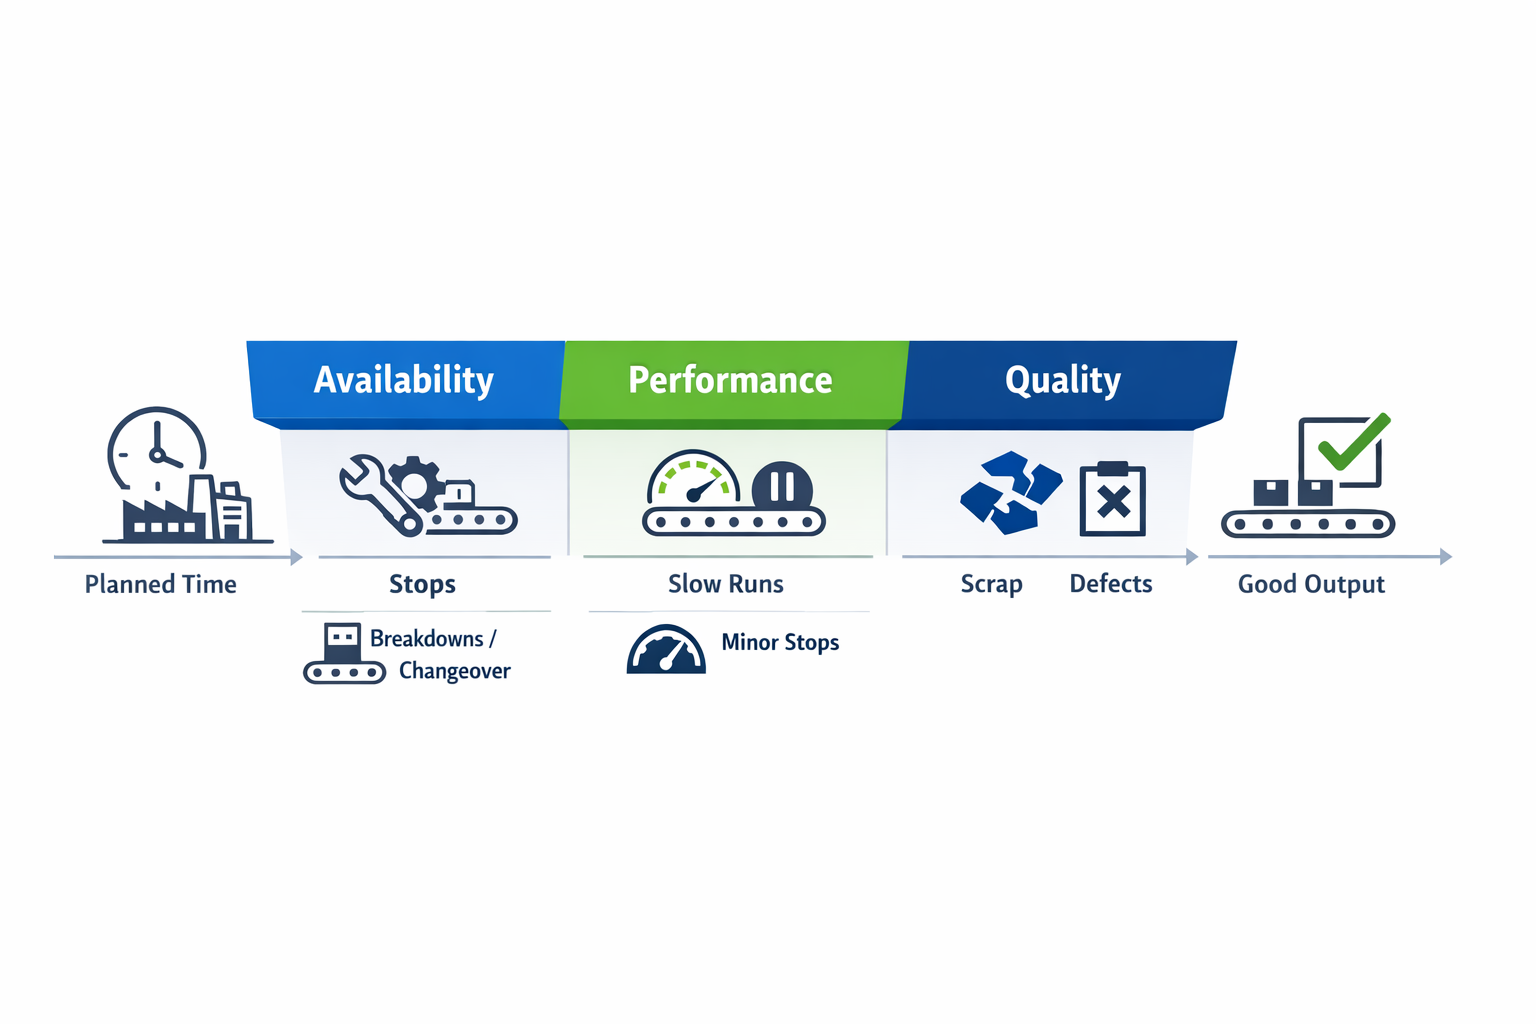
Availability Rate: Was the Equipment Running When It Was Supposed to Run?
Availability rate measures how much planned production time was lost because the equipment was stopped. This includes unplanned breakdowns, waiting for maintenance, changeovers if they are counted within planned production time, and other stoppages that prevent the machine from running. If a filler is scheduled for an 8-hour shift but loses 60 minutes to a jam and 30 minutes to changeover, availability reflects that lost run time.
This matters because a machine cannot create value while it is stopped, even if its speed and quality are excellent when running. Many plants track uptime, but availability in OEE is more disciplined because it is tied to scheduled production time, not total calendar time. For maintenance and production teams, this makes it easier to separate reliability losses from broader planning issues.
Performance Rate: Was the Equipment Running at Its Expected Speed?
Performance rate measures how close the equipment runs to its ideal cycle time while it is operating. It captures losses from minor stops, reduced speed, operator interventions, worn tooling, and process instability that slow output without creating a full downtime event.
This is the factor many factories underestimate because slow running often looks normal on the floor. A line that avoids major breakdowns can still post weak OEE if it consistently runs below target speed. That is why performance rate is essential in any serious OEE calculation: it reveals hidden capacity loss that uptime reports miss.
Quality Rate: How Much Output Was Good?
Quality rate measures the share of total units produced that meet the specification the first time. It reflects scrap, startup rejects, process defects, and sometimes rework, depending on how the plant defines good count versus total count.
This factor keeps OEE focused on usable output, not just volume. A line can show strong availability and performance, yet still deliver poor overall equipment effectiveness if too much of its production must be scrapped or corrected. For quality and operations leaders, that makes OEE a cross-functional metric rather than a machine-only measure.
What OEE Includes and What It Leaves Out
OEE includes the three direct loss categories that happen during planned production time: stops, slow running, and bad output. That makes it highly effective for line-level improvement, TPM activity, and daily production review. It is especially useful when paired with a clear reason-code structure and an OEE dashboard that manufacturing teams trust.
What OEE leaves out is equally important for interpretation. It does not tell you whether the production plan was realistic, whether demand was sufficient, or whether the asset was the right one for the product mix. So while OEE is a strong operational measure, it should be used alongside schedule attainment, maintenance cost, yield, and service metrics rather than as a standalone view of factory performance.
The OEE Formula Explained Step by Step
Start With the Standard OEE Formula
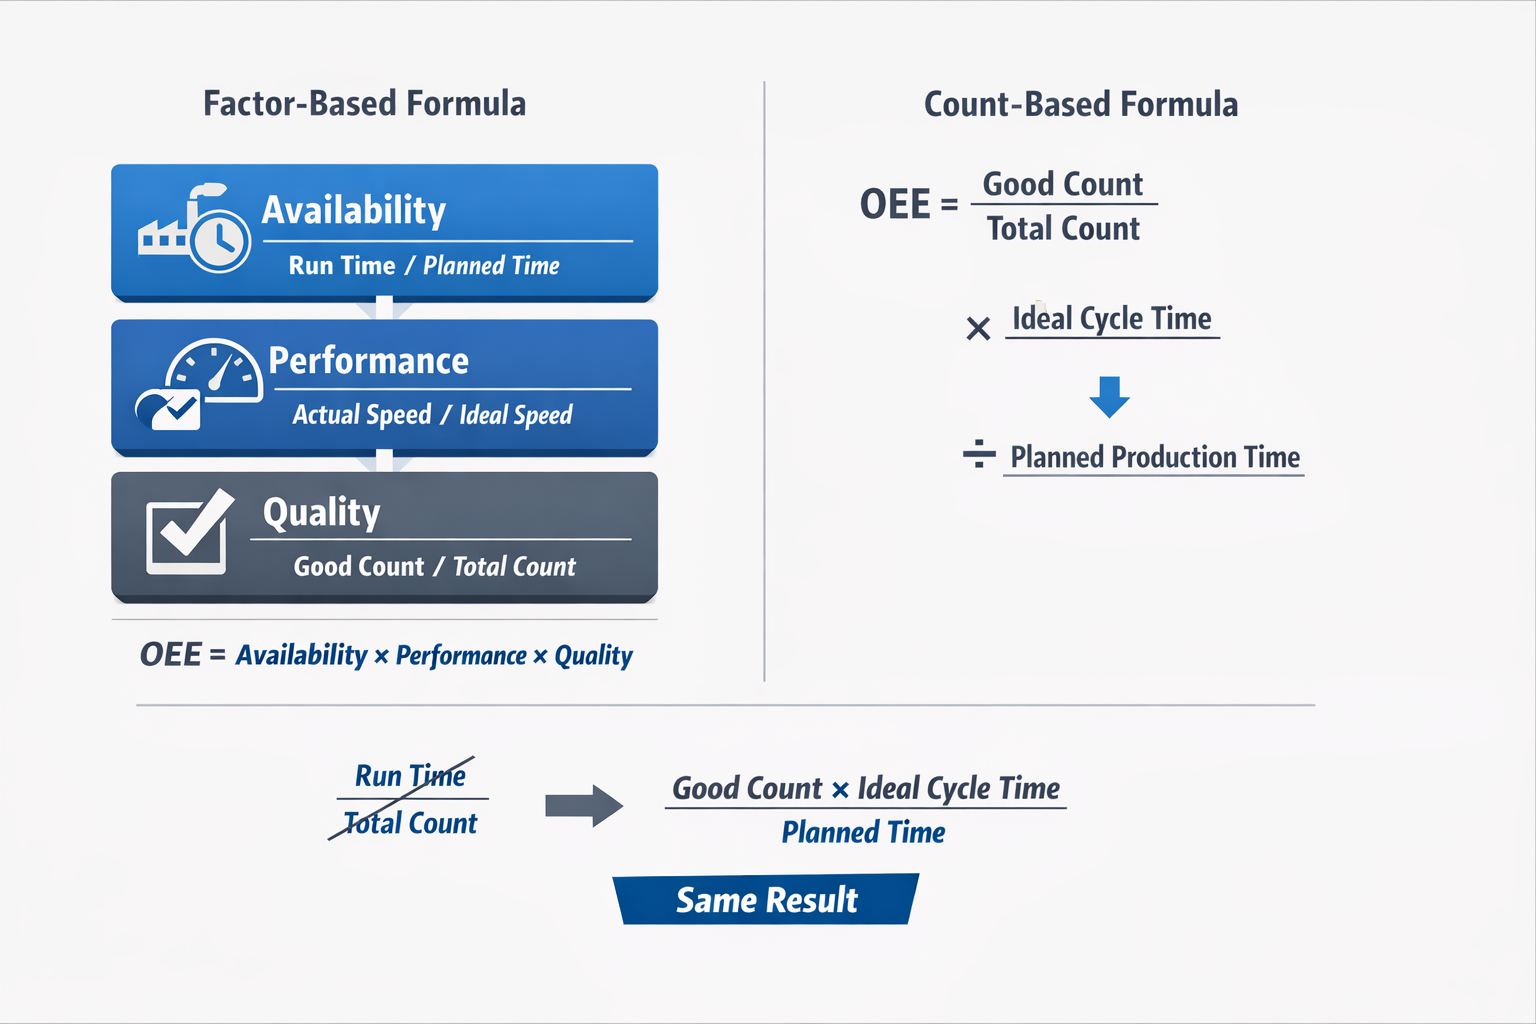
The standard OEE formula is straightforward: OEE = Availability × Performance × Quality. Each factor is expressed as a percentage, then multiplied to show how much of your planned production time was converted into good output at the expected speed. Therefore, the overall equipment effectiveness is more useful than looking at uptime, speed, or scrap alone. It combines the three loss categories into one equipment performance metric.
In practice, that means a line can have a strong availability rate but still post weak OEE if it runs too slowly or produces too much scrap. Likewise, a fast line with good quality can still underperform if breakdowns and changeovers consume too much run time. The value of the formula is that it forces you to see all three dimensions together rather than optimizing one in isolation.
Define the Inputs Before You Calculate
Before you do any OEE calculation, you need consistent definitions for the time and count inputs. Planned production time is the time the machine or line is scheduled to produce, excluding periods when production is not planned, such as plant shutdowns or no-order windows. Run time is planned production time minus stop time, including breakdowns, setups, changeovers, and other recorded downtime that occurred during the scheduled window.
You also need a clear standard for ideal cycle time, which is the fastest sustainable time to produce one unit under normal operating conditions. It should reflect a realistic engineering standard, not a best-ever burst speed that operators cannot maintain. On the count side, total count means every unit produced, including good units and rejects, while good count includes only units that meet quality requirements the first time or according to your plant’s agreed reporting rule.
Break Down the Three Formula Components
The first component is Availability = Run Time / Planned Production Time. This tells you how much of the scheduled window the equipment was actually running. It captures losses from unplanned stops and planned stops that are counted within production time, depending on your plant’s rules.
The second component is Performance = (Ideal Cycle Time × Total Count) / Run Time. This compares actual output against the maximum output you should have achieved during the time the machine was running. It captures speed losses such as minor stops, reduced running speed, and cycle instability that do not show up as full downtime events.
The third component is Quality = Good Count / Total Count. This shows how much of the total production was saleable output. It captures losses from scrap, startup rejects, and sometimes rework, depending on how your factory defines a good unit for reporting purposes.
How the Count-Based Formula Matches the Factor-Based Formula
You will also see the formula written as OEE = (Good Count × Ideal Cycle Time) / Planned Production Time. This version looks different, but it is mathematically equivalent to multiplying availability, performance rate, and quality rate together. It simply compresses the same logic into one expression by linking good output directly to the total planned time available.
If you expand the factor-based formula, the terms reduce cleanly:
(Run Time / Planned Production Time) × ((Ideal Cycle Time × Total Count) / Run Time) × (Good Count / Total Count). Run time cancels out, total count cancels out, and what remains is (Good Count × Ideal Cycle Time) / Planned Production Time. This is useful when validating system logic for reports or designing an OEE dashboard for manufacturing teams that must reconcile machine data with production counts.
Use the Right Formula for the Right Task
For day-to-day management, most plants prefer the factor-based view because it shows where losses occur. A single OEE percentage is useful, but it does not tell a production manager whether the main issue is downtime, reduced speed, or poor quality. The three-factor structure makes corrective action easier because each number points to a different operational lever.
The count-based version is still valuable for validation and reporting design. It helps confirm whether your reporting system is internally consistent, especially when you are mapping machine output, shift records, and good-count data into one calculation. In other words, one formula is better for diagnosis, while the other is often better for checking calculation integrity.
How to Do an OEE Calculation Without Getting Misleading Results
A Step-by-Step OEE Calculation Example
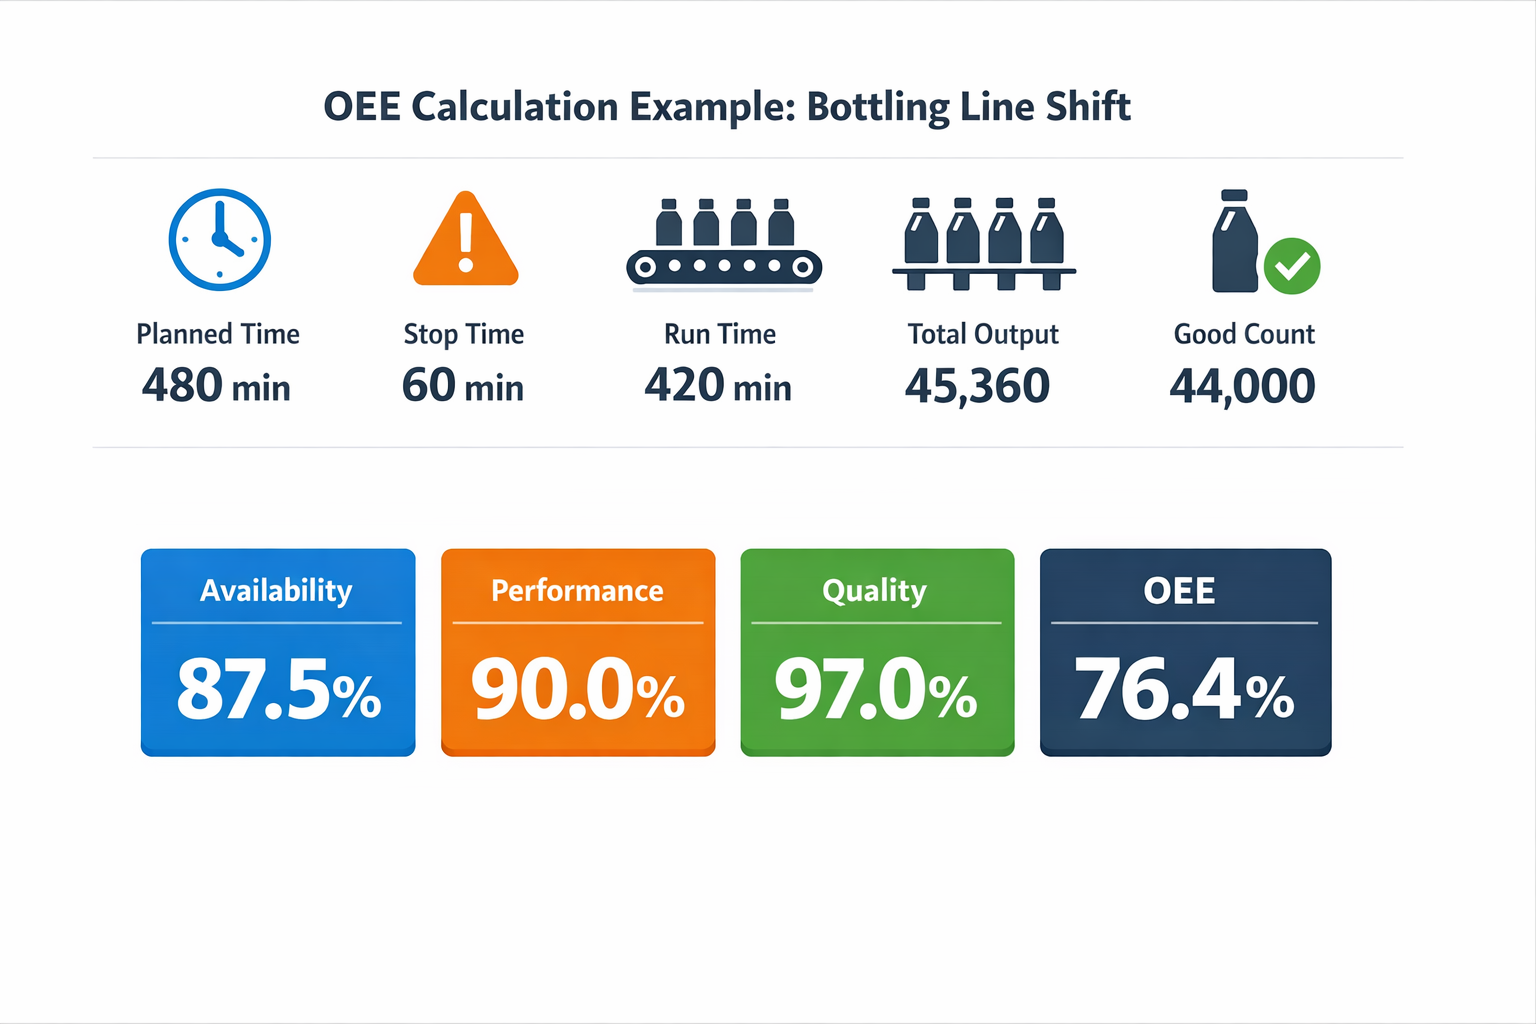
Use one consistent production scenario so the math stays clear. Assume a bottling line has a planned production time of 480 minutes for one shift. During that shift, the line stops for 60 minutes due to a changeover and an unplanned filler jam, so the actual run time is 420 minutes.
Start with the availability rate. The formula is Run Time ÷ Planned Production Time, so in this case, it is 420 ÷ 480 = 87.5%. This tells you the line was available to run for 87.5% of the scheduled time.
Next, calculate the performance rate using actual output against theoretical maximum output during run time. If the line’s ideal cycle time is 0.5 seconds per bottle, it should produce 120 bottles per minute, or 50,400 bottles in 420 minutes. If the actual total output was 45,360 bottles, then the performance rate is 45,360 ÷ 50,400 = 90.0%.
Then calculate the quality rate. If the total output was 45,360 bottles and 1,360 bottles were rejected for underfill and cap defects, the good count is 44,000. The quality rate is 44,000 ÷ 45,360 = 97.0%.
Now combine the three factors in the standard OEE formula: 가용성 × 성능 × 품질. That gives 87.5% × 90.0% × 97.0% = 76.4% OEE. In other words, only 76.4% of planned production time became fully productive time, making good parts at the expected rate.
What That OEE Result Actually Means
A 76.4% OEE calculation is not just a score for the shift report. It means that out of an eight-hour shift, the line delivered the equivalent of about 367 productive minutes at the ideal rate with good output, while roughly 113 minutes were lost across downtime, speed loss, and defects. That makes OEE a practical equipment performance metric because it converts several loss types into one operational picture.
The next management question is not whether 76.4% is “good” in isolation, but where the biggest loss sits. In this example, the largest gap comes from the availability rate 그리고 performance rate, not quality. A production manager would likely review stop duration and minor speed losses first, while maintenance would focus on the filler jam and recurring causes behind it.
Common OEE Calculation Errors That Distort Results
Unclear Planned Production Time
One of the biggest OEE calculation problems is starting with the wrong denominator. If one plant excludes breaks, meetings, and planned sanitation from planned production time, while another includes them, the same line can show very different results. Unless the time basis is standardized by line and shift, the OEE comparisons become unreliable.
Inconsistent Downtime Classification
Downtime coding often breaks the integrity of the availability rate. For example, one supervisor may log a 12-minute microstop as performance loss, while another records it as downtime. Over a month, those small classification differences can materially change OEE and lead teams to chase the wrong improvement priorities.
Missing Scrap or Rework Data
그만큼 quality rate is only as accurate as the reject data behind it. If operators record only final scrap but ignore startup loss, rework, or offline inspection rejects, the reported OEE will look stronger than actual line performance. This is common in plants where quality records sit in a separate spreadsheet from production output.
Unrealistic Ideal Cycle Times
그만큼 performance rate becomes misleading when the ideal cycle time is outdated, inflated, or negotiated rather than engineered. If the standard was set years ago for a different SKU mix or machine condition, the line may appear slow even when it is operating normally. The opposite is also true: a relaxed cycle standard can make weak performance look acceptable.
Why Similar Lines Can Report Different OEE
Two factories running similar packaging equipment can post different OEE numbers even when actual shop-floor performance is close. The difference often comes from data rules, not machine capability: how they define planned time, how they log stops, whether they capture all defects, and how they maintain standard cycle times. Before comparing sites or feeding numbers into an OEE dashboard for manufacturing, make sure the calculation method is consistent first.
What Data Do You Need to Track OEE Accurately and Report It in Real Time
Knowing the OEE formula is not enough if the underlying data is incomplete, delayed, or inconsistent. To make overall equipment effectiveness useful in daily management, you need a minimum data structure that captures both output and loss at the source. That means every OEE calculation should be built from the same core records, regardless of shift, line, or product mix.
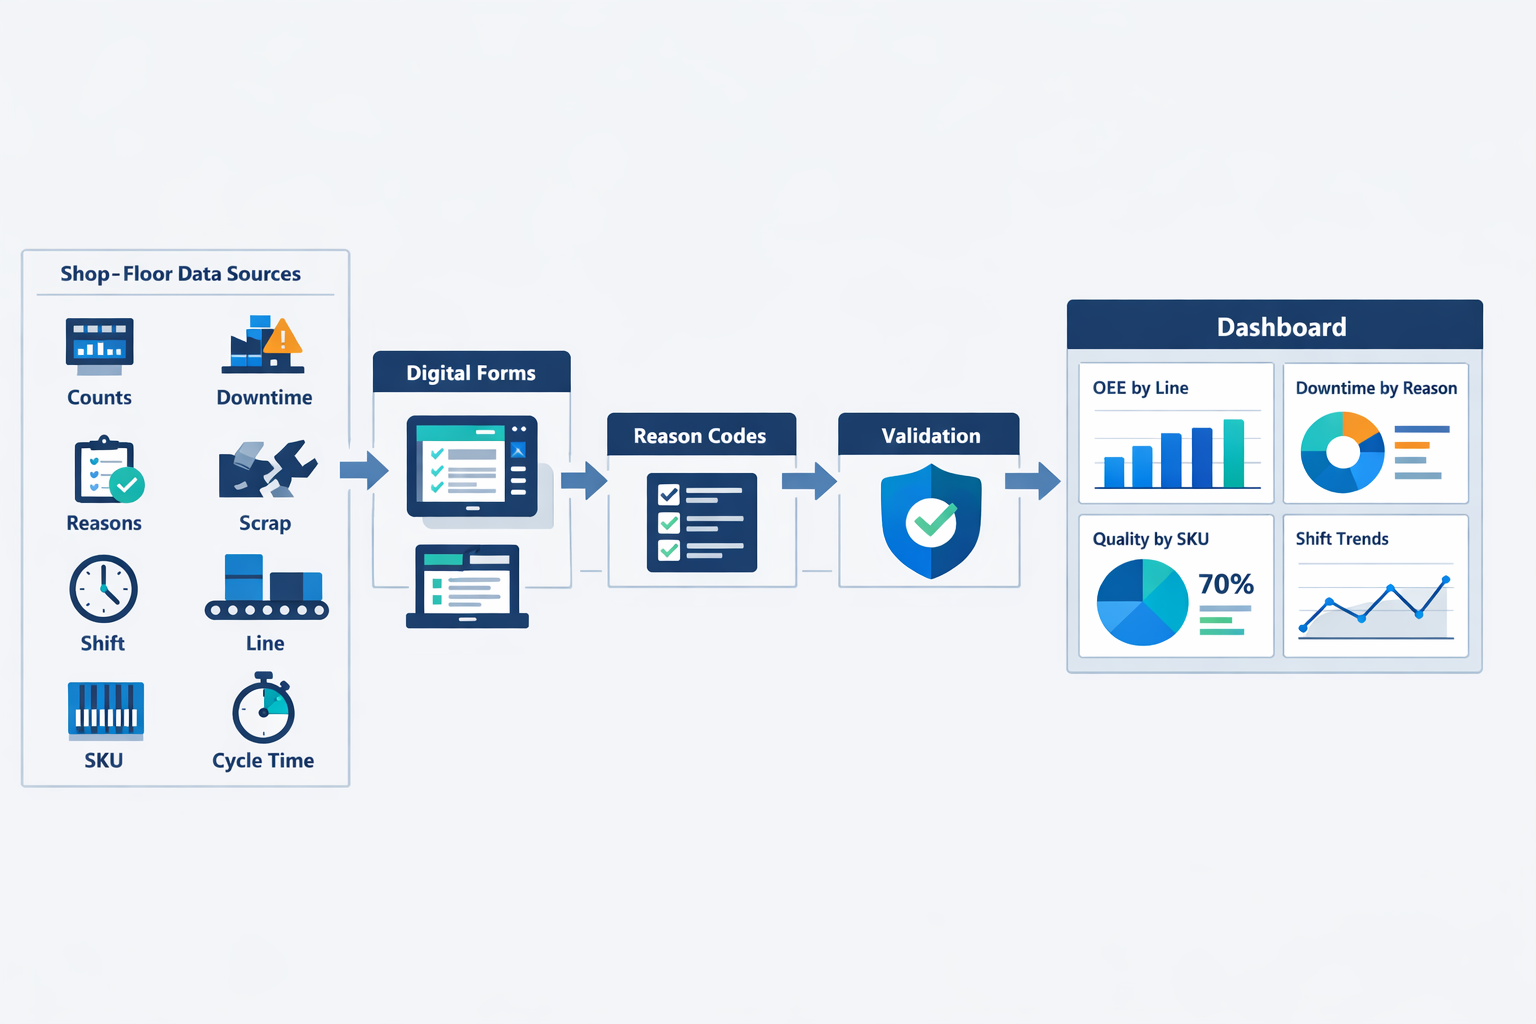
At a minimum, track production counts, downtime duration, downtime reasons, scrap and rework, shift, line, SKU, and target cycle time. These fields support the three OEE factors directly: downtime affects the availability rate, actual output against target cycle time affects the performance rate, and good units versus rejects affects the quality rate. Without this structure, the OEE metric becomes a spreadsheet estimate rather than a reliable operating signal.
A good rule is simple: if a supervisor cannot trace an OEE number back to a specific machine, shift, product, and loss event, the number is not yet management-grade. This is especially important in mixed-model manufacturing, where the target cycle time and expected reject profile can change by SKU. Real-time reporting only works when the data model reflects how production actually runs on the floor.
Standardize Data Capture
Operators should log start and stop times, output, rejects, and reason codes in a standard format, whether on a tablet, terminal, or mobile device. If one line records “minor stop” while another writes free-text comments, your OEE dashboard for manufacturing will show noise instead of patterns.
Standardization also means defining when data is entered. Some plants wait until the end of the shift, but that often creates missing downtime, rounded counts, and delayed scrap reporting. Capturing events as they happen improves the quality of the OEE calculation and gives production and maintenance teams a live view of what is affecting output now, not six hours later.
For higher-volume environments such as electronics assembly or beverage filling, even a one-minute data delay can distort short-interval performance trends. That does not mean every plant needs full machine integration on day one. It means manual and automated inputs must follow the same timestamp, line, and product logic so the final availability, performance, and quality numbers stay comparable.
Govern Downtime and Defect Reason Codes
Reason-code governance is where many OEE systems break down. If downtime reasons are too broad, you cannot separate changeover loss from breakdown loss; if they are too detailed, operators stop using them consistently. Most plants do better with a controlled reason tree: a short list of primary categories, then a second level for analysis.
The same principle applies to scrap and rework data. A rejected carton, solder defect, or fill-weight failure should not sit in a generic “NG” bucket if you want the quality rate to lead to action. Clear codes let lean, production, and maintenance teams see whether a low OEE result is driven by equipment condition, setup discipline, material issues, or operator practice.
Governance also requires validation. Supervisors should review exceptions such as overlapping downtime events, missing reject counts, or cycle times that do not match the SKU being produced. Without that checkpoint, two lines can report similar OEE percentages while hiding very different operational realities.
Design an OEE Dashboard Teams Can Trust
실용적인 OEE 대시보드 should not show only one percentage. It should let managers move from plant-level OEE into the drivers behind it: downtime by reason, speed loss by line, first-pass quality by SKU, and shift-by-shift trends. That is what turns overall equipment effectiveness from a reporting metric into a decision tool.
The most useful dashboard views are usually layered. A plant manager may need rolled-up OEE by factory and line, while a production manager needs shift comparison and top performance losses, and a maintenance manager needs recurring downtime by asset and failure code. Role-based visibility matters because each function uses the same data differently.
Jodoo is practical for manufacturers that want real-time OEE reporting without building a heavy custom system. You can use digital forms to standardize downtime logging and production reporting, workflows to route exceptions for review, and dashboards to display OEE by line, shift, SKU, and loss category in one place. That gives operations teams a controlled data pipeline instead of reworking Excel files after the shift has already ended.
Conclusion: Turn OEE from a Metric into Action with Jodoo
그만큼 OEE goes beyond a percentage on a report. It is a practical management system that shows where planned production time is being lost through downtime, speed loss, and quality defects, so your team can act on the real causes instead of debating the numbers. For plant, production, maintenance, and lean leaders, that matters because improvement starts with consistent definitions, reliable data capture, and visibility at the shift, line, and machine level.
와 함께 Jodoo, manufacturers can build no-code workflows to log downtime in real time, enforce standardized reason codes, connect production counts with scrap data, and display live OEE dashboards without rolling out a full MES.
If you want to turn OEE from a calculation into a daily operating discipline, Jodoo gives you a faster way to standardize and scale the process. 무료 체험을 시작하세요 또는 데모 예약하기 to see how it can fit your factory workflow.