Browse by category

Introduction: Why Capacity Planning Matters More Than Ever in Manufacturing
A recent McKinsey analysis found that manufacturers can lose 10% to 30% of productive capacity through avoidable inefficiencies such as downtime, poor scheduling, and unbalanced labor allocation. That is why capacity planning matters so much on today’s factory floor. In simple terms, it means matching people, machines, materials, and time to actual demand, so you can ship on schedule without locking excess cost into overtime, idle assets, or unnecessary headcount.
For production managers and supply chain managers, the challenge is rarely just “Do we have enough capacity?” More often, it is “Do we have the right capacity, at the right work center, on the right shift, at the right time?” Demand can swing quickly, customer lead times keep shrinking, and a single bottleneck can disrupt an otherwise well-loaded plant.
This article walks through the practical side of capacity planning in manufacturing. You will learn the difference between rough-cut planning and detailed scheduling, how to balance labor and equipment availability, how to calculate true available capacity, and why better operational visibility leads to faster, lower-risk planning decisions.
What Capacity Planning in Manufacturing Involves
Available Capacity vs. Required Capacity
In manufacturing, capacity planning starts with a simple comparison: how much output you need versus how much output your operation can realistically deliver. Required capacity comes from demand, production orders, or forecasted volumes translated into machine hours, labor hours, or line time. Available capacity is the usable production capability you actually have after considering shifts, staffing, equipment availability, and operating constraints. If those two numbers are misaligned, you either miss demand or pay too much to cover the gap.
In practice, production managers must evaluate capacity across several constraints at once, not assume one resource tells the whole story. That foundation matters before getting into how to do capacity planning in manufacturing in a structured way.
Rough-Cut Capacity Planning vs. Detailed Scheduling
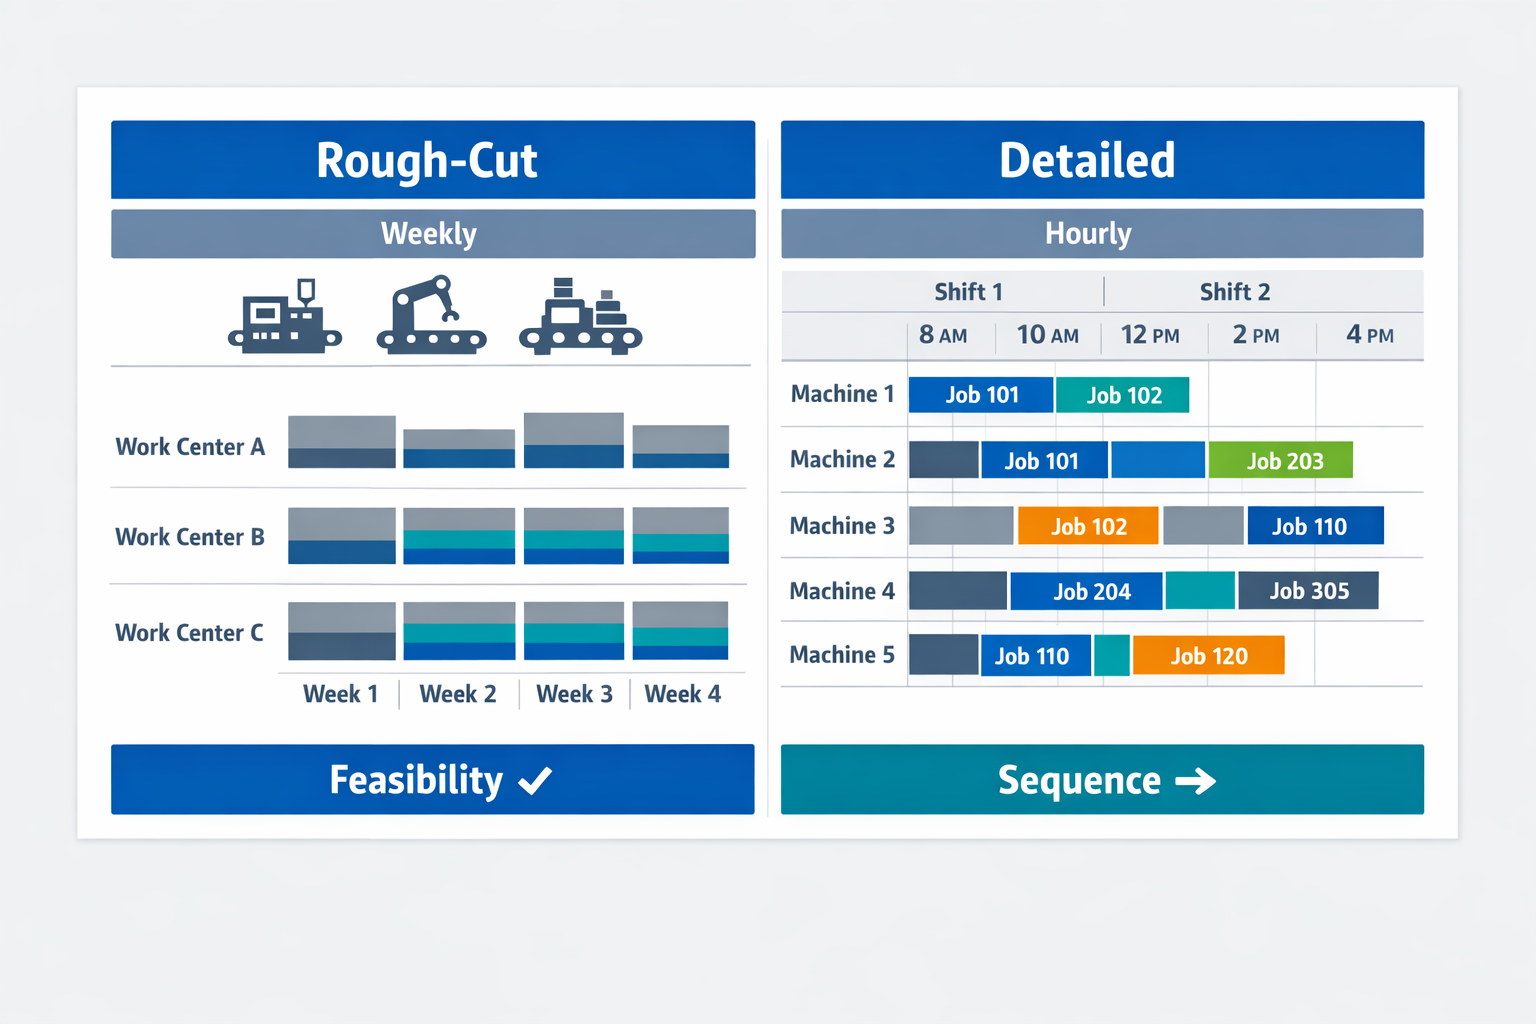
Rough-cut planning is a higher-level check used to test whether a master production plan is even feasible at critical work centers, lines, or departments before planners sequence every job. Detailed scheduling comes later and assigns specific orders to specific machines, shifts, and time slots based on actual priorities and rules.
Rough-cut planning typically works in weekly or monthly buckets and focuses on major constraints such as molding hours, assembly labor, or paint booth time. Detailed scheduling works at a much finer level, often by day, shift, or even hour, and accounts for sequence, setup, due dates, and dispatching logic. One tells you whether the plan is broadly achievable; the other tells operators exactly what runs next.
The Four Resource Buckets
Most factories need to assess four resource buckets together: labor, machines, materials, and time. Labor includes headcount, skill mix, shift coverage, and attendance reliability. Machines include nameplate capacity, uptime, maintenance windows, and changeover losses. Materials cover component availability, inbound timing, and whether shortages will block planned output.
Time is the common unit that ties these resources together. A planner may convert demand into standard hours by work center, then compare that against staffed and available hours by period. This is also why teams asking how to calculate manufacturing capacity utilization need more than one formula; utilization only becomes meaningful when the underlying available time is defined correctly. The detailed calculation comes later, but the planning logic starts here.
Planning Horizons: Short, Medium, and Long Term
Capacity decisions also change by planning horizon. Short-term planning usually covers days to a few weeks and is used to adjust overtime, shift assignments, subcontracting, or order priorities. Medium-term planning often spans one to six months and supports hiring plans, maintenance timing, tooling allocation, and inventory buffers. Long-term planning looks further ahead and informs capital investment, line expansion, facility layout, or supplier development.
Each horizon answers a different question. Short term asks, “Can we ship this month?” Medium term asks, “Do we need to rebalance labor and equipment next quarter?” Long term asks, “Should we add permanent capacity?”
Practical Capacity Planning Strategies for Manufacturers
Common strategies for production capacity planning include lead, lag, and match approaches. A lead strategy adds capacity ahead of expected demand, which can protect service levels but increases cost risk if forecasts miss. A lag strategy waits until demand is proven before adding capacity, which controls spending but can create missed orders or chronic overtime. A match strategy adds capacity in smaller steps as demand becomes clearer.
For example, a contract electronics plant launching a new customer program may use a lead strategy by training operators before volumes ramp. A furniture manufacturer facing uncertain export demand may prefer a lag approach and use temporary labor first. Many plants settle on a match strategy because it balances responsiveness with cost discipline.
How to Do Capacity Planning in Manufacturing Step by Step
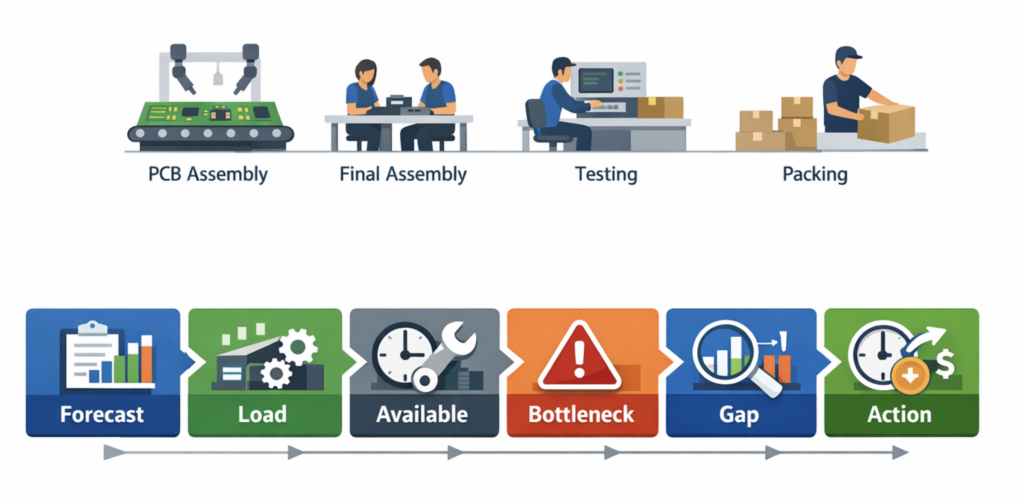
A practical capacity planning workflow should move from demand to action in a consistent sequence. In most factories, that means six steps: forecast demand, convert demand into required hours or units by work center, measure true available capacity, identify the bottleneck, compare the gap, and select the least-cost response. This is the core of how to do capacity planning in manufacturing without turning the exercise into a monthly spreadsheet ritual that arrives too late to help. To make the process concrete, consider an electronics assembly plant preparing next month’s production plan for industrial control panels.
Start With Demand by SKU and Period
The planner begins with confirmed orders, forecasted demand, and any contractual service-level commitments. In this example, the plant expects demand for 12,000 control panels next month, split across three models with different assembly and test times. Instead of planning only at total-factory level, the planner breaks demand into weekly volume because labor allocation and machine loading will change across the month. This makes the forecast usable for capacity planning rather than just for sales reporting.
Translate Demand Into Work Center Load
Next, demand must be converted into load on each major work center, such as PCB assembly, final assembly, testing, and packing. If Model A requires 0.18 labor hours in final assembly and 0.07 machine hours in testing, those standard times can be multiplied by the planned mix to estimate required capacity. In the control panel plant, final assembly comes to 2,340 required hours, while testing comes to 1,120 required hours for the month. This is where many teams first see whether demand is heavy in labor, equipment, or both.
Assess True Available Capacity
The planner then checks what capacity is actually available, not just what the shift calendar suggests. Final assembly may appear to have 2,560 hours available from headcount and shifts, but approved leave, training time, and line meetings reduce that figure. Testing may show 1,200 machine hours on paper, yet planned calibration and weekend shutdowns cut into usable time. At this stage, you are not yet doing a full utilization calculation, but you are building the realistic denominator that later supports how to calculate manufacturing capacity utilization properly.
Identify the Real Bottleneck
With required and available hours side by side, the next task is to find the constraint that will limit output first. In the example, testing still has a small buffer, but final assembly drops to roughly 2,280 true available hours against 2,340 required hours, creating a shortfall. That means final assembly, not testing, is the immediate bottleneck for next month’s plan. This step matters because the right strategies for production capacity planning depend on the specific constraint, not on average plant utilization.
Compare the Gap and Choose Corrective Actions
Once the gap is visible, the planner evaluates response options by cost, speed, and operational risk. For a 60-hour shortfall in final assembly, the plant could add targeted overtime, reassign cross-trained operators from packing during lighter weeks, smooth the schedule by pulling some orders forward, or subcontract a small portion of low-complexity work.
How to Calculate Manufacturing Capacity Utilization and True Available Capacity
Start With Design Capacity and Effective Capacity
To calculate capacity well, separate design capacity from effective capacity. Design capacity is the theoretical maximum output under ideal conditions, such as a stamping press rated for 1,200 parts per shift or a filling line rated at 18,000 bottles per hour. Effective capacity is lower because it reflects normal operating limits, including routine setups, cleaning, quality checks, and standard breaks.
A simple way to express it is: Effective Capacity = Design Capacity – Planned Losses. Planned losses usually include scheduled maintenance, changeovers, sanitation, shift handovers, and legally required breaks. For example, if a packaging line is designed for 10 hours of production but loses 1.5 hours each shift to planned stops, its effective capacity is 8.5 hours, not 10.
Use the Right Capacity Utilization Formula
Once you have effective capacity, you can calculate utilization with a formula production teams can act on: Capacity Utilization = Actual Output / Effective Capacity × 100. If a machining cell can realistically produce 800 parts per day at effective capacity but only delivers 680 parts, utilization is 85%.
You can also calculate utilization in hours instead of units when product mix varies. In a job shop producing multiple SKUs, comparing standard labor or machine hours often gives a more accurate picture than comparing finished-piece counts. For example, 54 actual spindle hours used out of 60 effective spindle hours means utilization is 90%, even if the product mix changed during the week. This makes the metric more reliable for mixed-model environments.
Estimate True Available Capacity After Real-World Losses
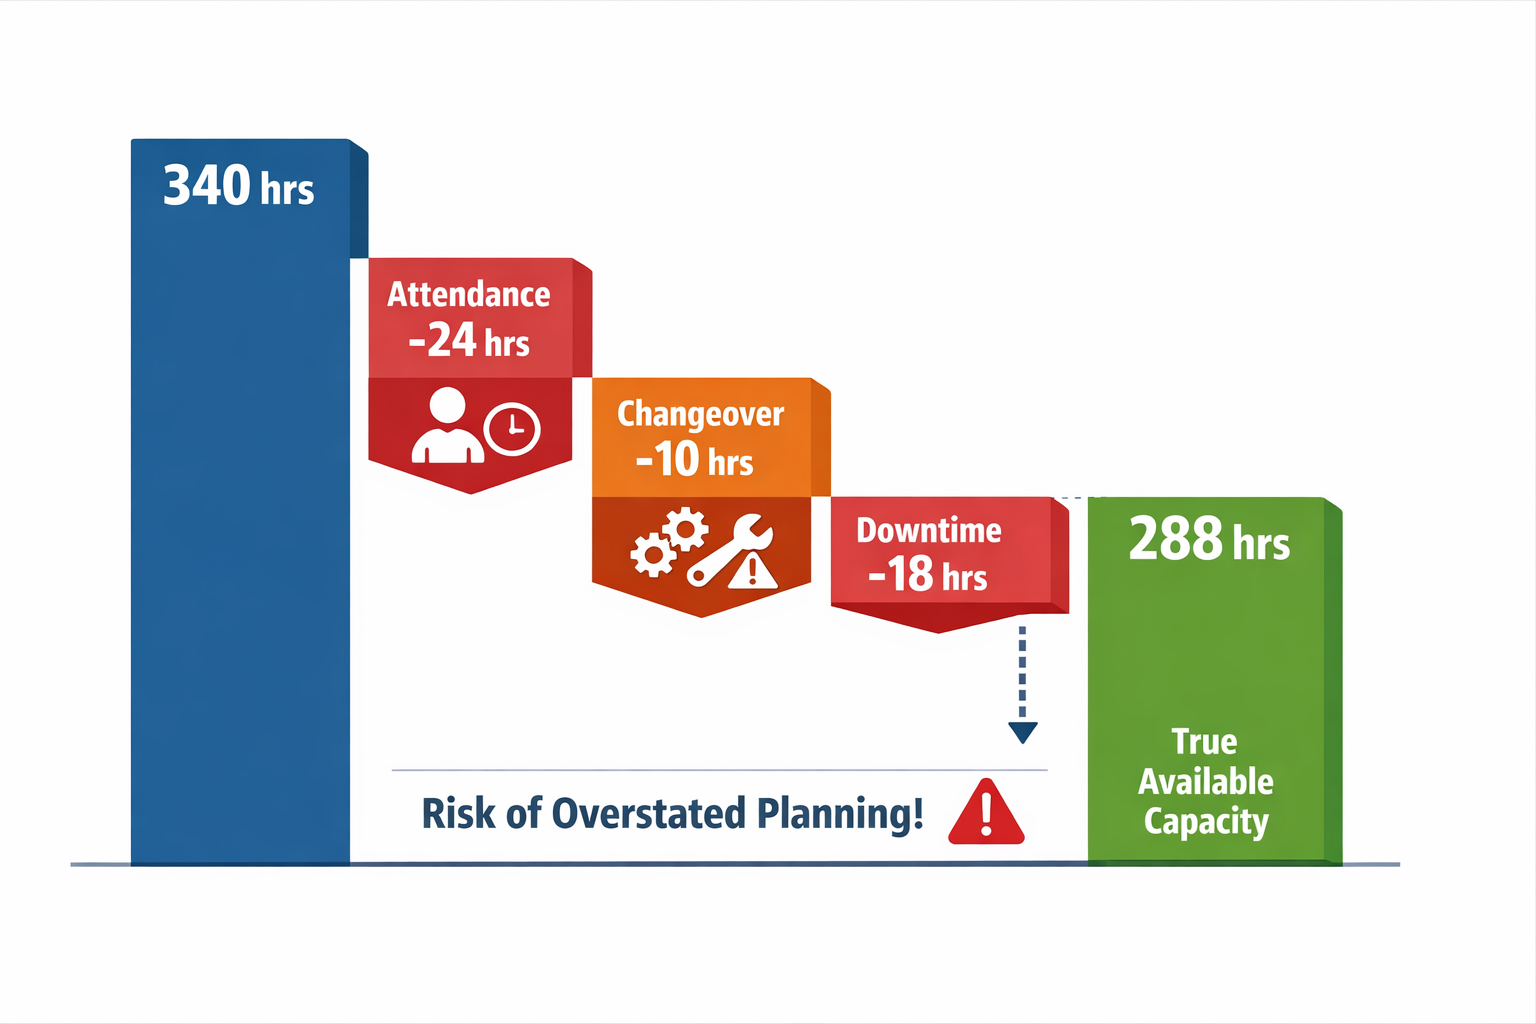
Effective capacity is still not the same as true available capacity for the next shift, day, or week. To estimate true availability, subtract variable losses that are not guaranteed in the base plan: absenteeism, reduced staffing, unplanned downtime, scrap-related reruns, minor stoppages, and material delays. A practical formula is: True Available Capacity = Effective Capacity – Attendance Losses – Unplanned Downtime – Disruption Losses.
Consider an assembly line scheduled for 340 effective labor hours this week. If absenteeism removes 24 hours, changeover overruns remove 10 hours, and an unscheduled conveyor fault removes 18 hours, true available capacity falls to 288 hours. A spreadsheet that still plans against 340 hours overstates output by about 18%. That gap is large enough to distort promised ship dates and overtime decisions.
Convert Capacity Into a Planning Decision
The final step is to compare true available capacity with required load by work center, then decide what action is justified. If utilization is consistently above 85% to 90% at the constraint, small disruptions can quickly turn into missed orders, so planners may need schedule smoothing, temporary labor, subcontracting, or batch-size changes. If utilization is too low, the answer may be fewer shifts, cross-training redeployment, or maintenance timing adjustments.
Smart Strategies for Production Capacity Planning
Why Good Capacity Plans Still Fail on the Shop Floor
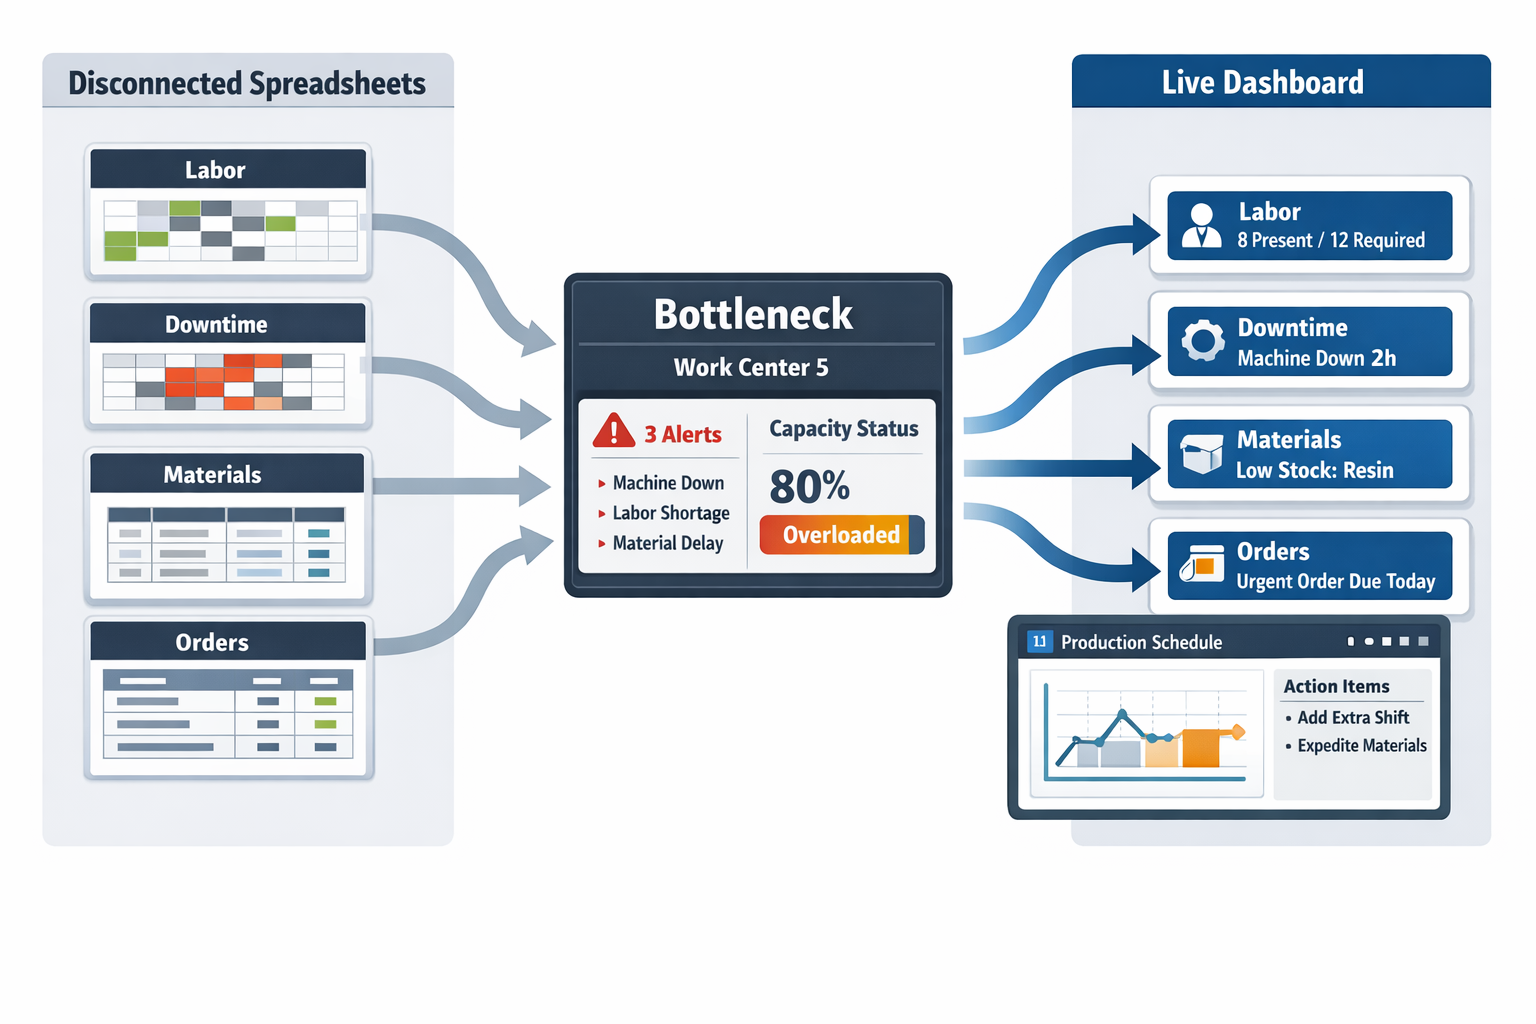
Many capacity planning failures do not start with bad formulas. They start when planners work from numbers that are already wrong by the time the schedule is reviewed. A spreadsheet may show enough hours for the week, but the actual plant may be short two certified welders, one CNC line may be down for bearing replacement, and the night shift may have been reduced for three days. When that gap is invisible, the plan looks feasible on paper and fails in execution.
Disconnected spreadsheets are a common cause. Production, HR, maintenance, and warehouse teams often maintain separate files with different update cycles, so no one is looking at the same version of available capacity. This is where many teams struggle with how to do capacity planning in manufacturing consistently: the logic may be sound, but the inputs are fragmented. In practice, capacity planning becomes a manual reconciliation exercise instead of a fast management process.
Outdated shift calendars create another distortion. If a planner assumes a standard six-day schedule but one work center is running a holiday-adjusted week or reduced overtime, the available hours are overstated before production even starts. The same issue appears when labor attendance is missing or delayed, especially in plants that depend on multi-skilled operators who cannot be replaced easily. One absent technician can cut the true output of an entire line, even when machine hours appear unchanged.
Hidden Capacity Losses Across Functions
Machine downtime is often captured too late to influence planning decisions. Maintenance may know a critical press is unstable, and supervisors may know changeovers are taking longer than standard, but that information does not always feed back into the planning file quickly enough. As a result, teams that know how to calculate manufacturing capacity utilization still make poor decisions because the utilization is based on stale assumptions rather than live conditions.
Poor cross-functional communication compounds the problem. If sales commits an urgent order, procurement flags a material delay, and maintenance schedules preventive work without a shared review, each function is acting rationally in isolation. The factory then absorbs the conflict through overtime, expediting, and schedule reshuffling. That is expensive capacity, not managed capacity.
Spreadsheet-based planning is usually static: it tells you what should happen if all assumptions hold. Real-time, exception-based planning tells you what has changed, where the risk sits, and which work center needs intervention first. That difference matters because most plants do not miss plan due to average conditions; they miss it because a few exceptions go unseen for too long.
Smarter Strategies for Production Capacity Planning
A better approach starts with planning by constraint. Instead of spreading attention evenly across every process, review the work center that most limits throughput and protect it first. In many plants, one coating booth, furnace, filling line, or test station determines weekly output far more than total factory headcount. This is one of the most practical strategies for production capacity planning because it focuses decisions where lost hours are most expensive.
Buffers should also be selective, not universal. Adding blanket safety time to every order inflates lead times and hides inefficiency, while no buffer at all leaves the schedule brittle. A better method is to place time or capacity buffers around unstable resources, high-mix changeover points, or supplier-dependent operations. That makes the plan more resilient without building waste into every job.
Finally, review capacity by shift and work center, not only by plant totals, and escalate exceptions quickly. A factory can show 85% overall utilization and still miss shipments because one bottleneck cell is overloaded on second shift. Short, structured reviews that combine labor attendance, downtime status, and order priorities help managers act before shortages become expediting costs.
Conclusion: Turn Capacity Planning into a Real-Time Decision System with Jodoo
Good capacity planning is not just a forecasting exercise or a spreadsheet formula. It depends on how quickly you can see real operating conditions, including who is on shift, which machines are available, where downtime is building, and whether actual output is tracking against plan. When that visibility is delayed or fragmented, even a well-built plan becomes outdated within hours.
For many manufacturers, the gap is not a lack of planning logic but a lack of connected execution data. As a no-code lean manufacturing platform, Jodoo helps operations teams digitize shift schedules, capture labor attendance in real time, log machine downtime, and monitor live dashboards by work center, line, or plant. This gives production and supply chain managers a practical bridge between manual spreadsheets and large ERP or APS projects.
If you want capacity planning to become a faster, more reliable decision system, it is worth exploring a setup that connects planning assumptions to shop-floor reality. You can start a free trial or book a demo to see how Jodoo supports manufacturing capacity planning in day-to-day operations.