
Browse by category
Introduction: Why Cycle Time Matters in Modern Manufacturing
A production line can appear to meet its output target and still miss customer delivery when too much time is lost during processing, handling, waiting, or handoffs. That is why cycle time is one of the most useful shop-floor metrics for production managers, plant managers, and industrial engineers. In simple terms, cycle time is the time it takes to complete one unit, one operation, or one defined production step under normal conditions.
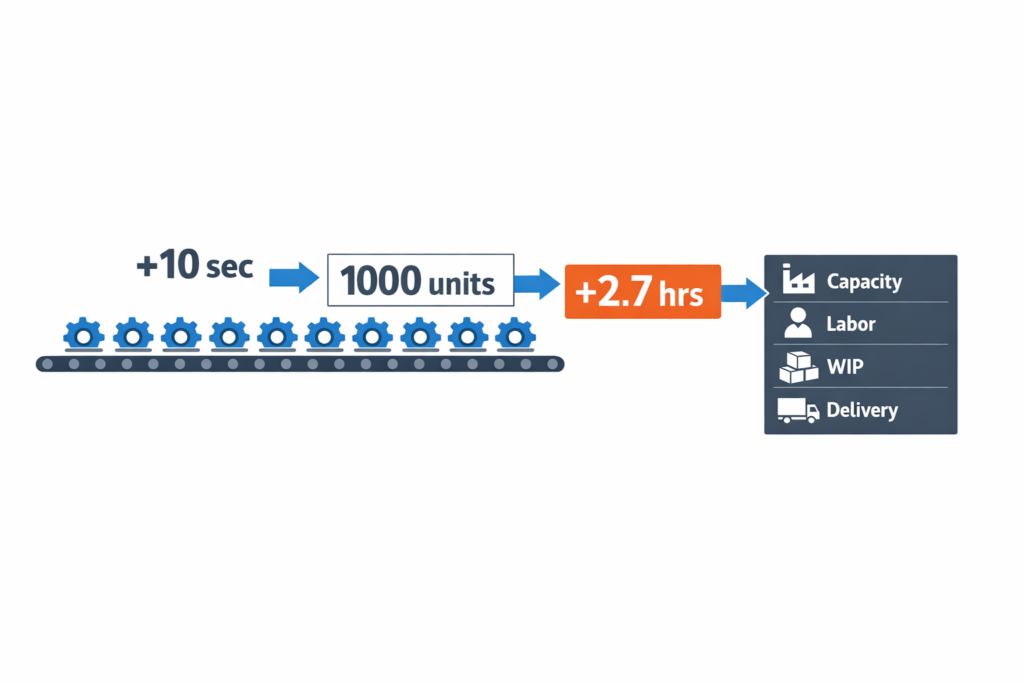
This metric matters because small losses add up fast. For example, a process that adds just 10 seconds per unit creates nearly 2.7 extra hours of production time over 1,000 units. Across a shift, that directly affects capacity, labor utilization, WIP, and on-time delivery. Unlike broader KPIs, cycle time points you to where performance is actually changing: at the machine, station, cell, or work order.
In this article, you will see what cycle time means in manufacturing, how to use the cycle time formula, and how to calculate it at both the process and work-order level. We will also compare it with the takt time and lead time, then walk through practical ways to reduce it. For many factories, accurate cycle time tracking is what makes lean manufacturing practical at the shift, line, and work-order level.
What Cycle Time Means in Manufacturing
Define Cycle Time Precisely
In manufacturing, cycle time is the time required to complete one unit, one batch step, or one operation under defined conditions. The key phrase is “under defined conditions” because the number depends on where you start the clock, where you stop it, and whether you include handling, waiting, or changeover. If your team does not define those boundaries clearly, the same production line can appear to have three different cycle times in three different reports.
For practical shop-floor use, manufacturing cycle time usually answers one of two questions: How long does one process step take? Or how often does one finished unit come out? That is why the cycle time formula matters, but only after the team agrees on the exact event points being measured. Without that agreement, comparisons across shifts, machines, and SKUs become misleading.
What Cycle Time Does Not Mean
Cycle time is often treated as a catch-all term for speed, but it is not the same as every time-based KPI in production. A line can have a short machine run time and still a long production cycle time if operators wait for material, quality clearance, or forklift movement. In the same way, a work order can have an acceptable process cycle time but poor overall delivery performance because queue time and scheduling delays sit outside the measured step.
This is where many bad decisions start. If a manager confuses cycle time with lead time, they may invest in faster equipment when the real issue is waiting between operations. If they confuse cycle time with takt time, they may believe the process is healthy because demand is low, even though the line is still unstable.
Cycle Time vs. Other Common Manufacturing Metrics
| Metric | What It Measures | Typical Start/Stop | Best Used For | Common Mistake |
|---|---|---|---|---|
| Cycle Time | Time to complete one unit or one operation | Start of operation to end of operation, or one completed unit to the next | Evaluating process speed, line balance, and operational performance | Using it without defining whether waiting or handling is included |
| Takt Time | Required production pace to meet customer demand | Available production time ÷ customer demand | Capacity planning and demand alignment | Treating takt time as actual performance |
| Lead Time | Total elapsed time from order release to delivery or completion | Order received/released to customer delivery or finished order | Customer service, planning, and order fulfillment | Assuming a shorter cycle time automatically means a shorter lead time |
| Throughput Time | Total time a part spends moving through production, including waiting | Entry into production to exit from production | End-to-end flow analysis and WIP diagnosis | Confusing it with pure processing time |
| Machine Time | The time machine is actively running on the part | Tool starts to tool stops | Equipment utilization and process engineering | Ignoring manual handling, setup, and queue losses |
Cycle Time vs. Takt Time
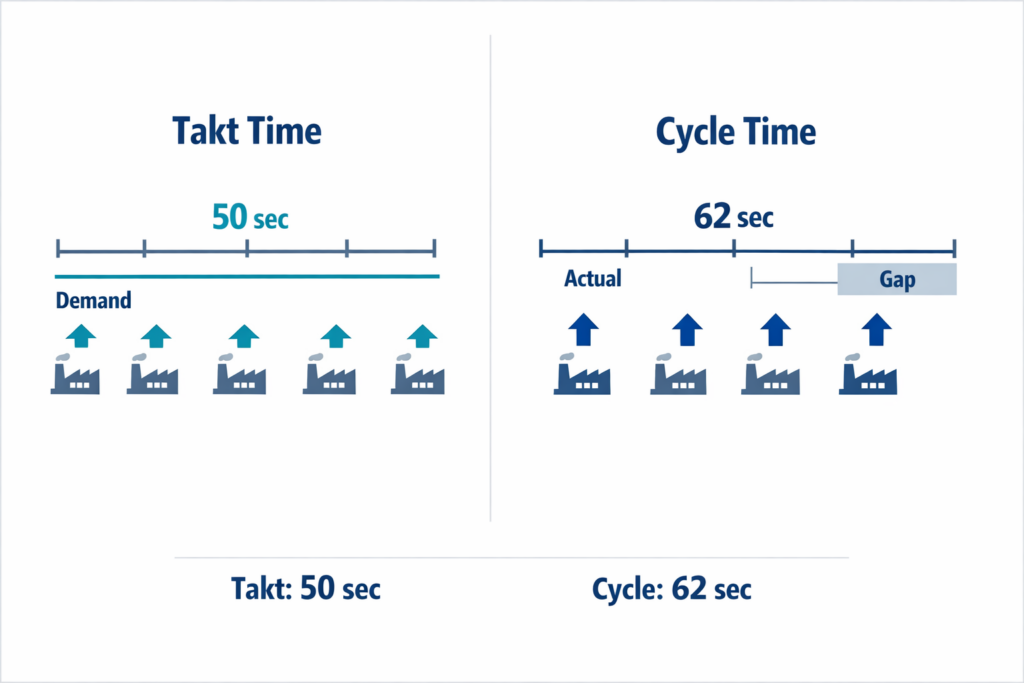
The comparison between cycle time and takt time is one of the most important in lean operations. Takt time tells you the pace required by demand, while cycle time tells you the pace your process is actually achieving. One is a target rate; the other is a measured operating result.
If takt time is 50 seconds per unit and actual cycle time is 62 seconds, the line cannot keep up with demand without overtime, added capacity, or a process change. If cycle time is 40 seconds, that does not automatically mean the process is efficient, because excess output can still create overproduction, higher WIP, and imbalance downstream. So in cycle time vs takt time decisions, the real question is not which one is better, but whether actual performance is aligned with demand.
Lead Time, Throughput Time, and Machine Time: Where Teams Get Confused
Lead time is broader than cycle time because it includes the full elapsed time around the order, not just the operation itself. Throughput time is also broader, but it is usually focused on the part’s journey through production, including queue, transport, and waiting between steps. Machine time is narrower because it measures only the equipment’s active running time.
This distinction matters in real factories. A stamping press may show 18 seconds of machine time, while the measured cycle time at the cell is 30 seconds after loading and unloading are included. The same part may still spend 6 hours of throughput time in the plant because it waits in front of secondary operations, and the customer may experience 3 days of lead time because planning, batching, and dispatch add more delay.
Why Clear Definitions Matter Before You Use the Numbers
When teams mix these terms, improvement priorities become distorted. Engineering may focus on reducing machine seconds, while production supervisors are actually losing output in material waiting and shift handoff gaps. Finance may ask for shorter lead times, but the line team is reporting only the operation cycle time, so both sides think the other is missing the point.
Therefore, before teams use these numbers in meetings, dashboards, or improvement targets, they should define the start and stop points for each metric. Once those definitions are fixed, the data becomes usable for comparing shifts, understanding variation, and supporting cycle time reduction work. The next step is to calculate it correctly at both the process and work-order levels.
How to Calculate Cycle Time at the Process and Work-Order Level
Once you have a clear definition of manufacturing cycle time, the next step is choosing the right calculation method for the decision you need to make. A line supervisor checking one station needs a different number than a production manager reviewing a full work order. In practice, the cycle time formula changes slightly depending on whether you are measuring one repeated operation, one machine center, or the total elapsed time to complete a batch. Using the wrong level of calculation is one reason teams confuse true production cycle time with rough averages.
The Basic Cycle Time Formula
At the simplest level, cycle time is:
Average Cycle Time = Total Production Time ÷ Number of Units Produced
This formula works well when you want an average output rate over a stable run. If a packing cell runs for 420 minutes and produces 210 units, the average cycle time is 2 minutes per unit. This is useful for high-level planning, line balancing, and quick capacity checks, but it assumes the run conditions were reasonably consistent.
The limitation is that this average can hide operational detail. If the same cell had two short stoppages, a material wait, and a slow first-off setup, the average still shows 2 minutes per unit even though the true process behavior is less stable. That is why production teams often calculate cycle time at both the process level and the work-order level.
Running Example: A CNC Machining Work Order
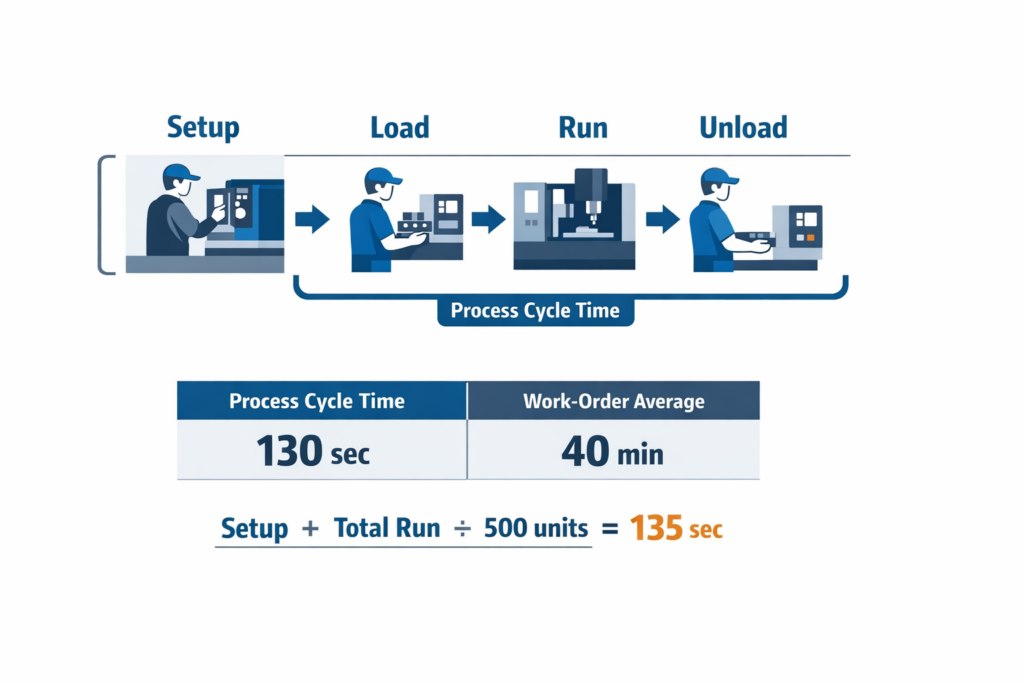
Assume a plant is producing 500 aluminum valve bodies on a CNC machining center. For each part, the operator loads the raw casting, starts the cycle, waits for machining to finish, unloads the part, and places it in the next-stage rack. At the start of the order, the team also performs setup and tool offset checks before the first acceptable part is released.
This example lets you see how the math changes by context. The machine-level number helps you understand the operation itself, while the work-order number shows what production planning actually experiences. Both are valid, but they answer different questions.
Process-Level Cycle Time: One Repeating Operation
If you want to measure the machining process itself, you usually focus on the repeatable time per unit under normal running conditions. Let us say one observed cycle includes:
- Load raw part: 20 seconds
- Machine run time: 95 seconds
- Unload finished part: 15 seconds
The process-level cycle time is:
20 + 95 + 15 = 130 seconds per unit
This is often the most practical form of the cycle time formula for station design and standard work analysis. It captures operator touch time plus machine time for one completed unit, which is far more useful than relying only on machine runtime. If you excluded loading and unloading, you would report 95 seconds, but that would understate the real output pace of the station.
When to Include Setup and Changeover
Now look at the same work order from the planner’s perspective. Before the 500-part run starts, the team spends 40 minutes on setup, fixture verification, and first-piece inspection approval. If you want the average work-order cycle time, that setup time should be included because it consumes available production time.
The work-order calculation becomes:
Total Work-Order Time = Setup Time + Total Running Time
If each unit takes 130 seconds, then machining 500 units requires:
500 × 130 seconds = 65,000 seconds = 1,083.3 minutes
Add the 40-minute setup:
1,083.3 + 40 = 1,123.3 minutes total
Then divide by 500 units:
1,123.3 ÷ 500 = 2.25 minutes per unit, or about 135 seconds per unit
That extra 5 seconds per unit may look small, but across multiple short runs, it has a major effect on available capacity. In high-mix environments, frequent changeovers can consume 10% to 30% of planned production time, which is why setup must be visible in work-order cycle time.
Process Cycle Time vs Work-Order Cycle Time
Process-level cycle time tells you how long one operation takes once the job is running steadily. Work-order cycle time tells you how much time the order actually consumes when setup and other order-level activities are included.
In our example, the process-level cycle time is 130 seconds, while the work-order average is 135 seconds. If you are balancing labor or comparing one machine to another, use the process-level number. If you are estimating completion dates, scheduling finite capacity, or quoting realistic output rates, use the work-order figure.
Choosing the Right Data Inputs
Cycle time data is only useful when every team captures the same start and stop events. On most shop floors, teams pull data from machine signals, operator logs, MES records, or manual production sheets. The important point is not only the data source but also consistency.
For the CNC example, common timestamp choices include job start, first good part, last good part, and job complete. If one supervisor measures from the first good part to the last good part while another measures from operator login to pallet close, the reported manufacturing cycle time will not be comparable. This is also where some teams mistakenly mix cycle time vs takt time in discussion, even though takt is a demand-based pacing metric rather than an observed process duration.
A practical rule is to define the event boundaries before you start reporting. For process-level analysis, use repeatable unit events such as load start to unload complete. For work-order analysis, use order-level events such as setup start to final quantity complete. This keeps the number tied to a real management decision.
A Simple Average vs a More Realistic Production Calculation
A simple average is enough when the process is stable, the run is long, and setup is negligible relative to output. That is common in dedicated lines producing the same SKU for hours or days. In that case, total run time divided by total units gives a reliable baseline for capacity planning.
A more realistic production cycle time calculation is needed when the environment includes short runs, frequent model changes, operator handling, inspections, or approval steps between batches. In those cases, excluding setup, loading, unloading, or first-piece release creates a misleadingly low cycle time. The result is usually poor schedules, overstated capacity, and avoidable expediting.
For the CNC order, a simple machine-only view might report 95 seconds. A process-level operational view reports 130 seconds. A work-order planning view reports 135 seconds. None of these numbers is wrong; they are just answering different operational questions.
Use Both Numbers, but Label Them Clearly
The most effective plants do not force one universal cycle time number across every use case. They maintain a standard naming convention such as net process cycle time, observed cycle time, and work-order average cycle time. This avoids confusion later when teams start comparing performance across products, shifts, or machines.
That discipline also makes later cycle time reduction work much easier. If your baseline already separates machining time from handling time and setup time, you can see exactly where improvement is possible instead of debating the math. In short, the calculation is not just an engineering exercise; it is the foundation for better scheduling, labor planning, and improvement action.
The Reason Drives Long Cycle Times on the Shop Floor
After defining and calculating the cycle time, the next challenge is finding what makes it longer than expected. In most plants, the answer is not one slow machine. Long manufacturing cycle time is usually created by a chain of small delays across material flow, people, equipment, quality, and decision-making. That is why two lines with similar rated speed can deliver very different output per shift.
Bottlenecks and Uneven Line Balance
A bottleneck sets the pace for the entire process, even when upstream machines appear fast on paper. If one station consistently runs slower than the rest, WIP builds in front of it, operators wait behind it, and the end-to-end production cycle stretches far beyond the theoretical machine rate. This is one reason teams that focus only on machine nameplate speed often miss the real cause of poor flow.
In an automotive component plant, for example, stamping may complete a part in seconds, but a slower inspection or welding step can constrain the line. The result is a growing queue, more handling, and a longer time from release to finished unit. In practice, a station may hit its own short machine cycle, yet the overall line still fails takt because the bottleneck governs output.
Waiting, WIP, and Material Handling Delays
Excess WIP is often treated as protection, but it frequently hides unstable flow and adds waiting time between operations. A unit may spend only a few minutes being processed and far longer sitting in racks, on pallets, or in staging zones. In many factories, this waiting time becomes a larger share of end-to-end production flow time than the actual touch time.
Electronics assembly provides a common example. Boards may be printed and placed quickly, then sit in a queue before testing because fixtures, technicians, or approval capacity are limited. The line looks busy, but the end-to-end production cycle expands because material moves in batches and waits for the next available resource.
Changeovers and Small-Stop Losses
Frequent changeovers can sharply increase cycle time, especially in high-mix production. Even when the scheduled changeover is only 10 to 20 minutes, the real loss is often larger because it includes line clearance, first-piece checks, parameter adjustment, and restart instability. If SKU sequencing is poor, these repeated interruptions can consume a significant share of available time.
Small stops matter as well. A line that loses 30 to 60 seconds repeatedly to sensor faults, label jams, or feeder replenishment may never show dramatic downtime in reports, yet the accumulated effect can be substantial. In many discrete plants, these short interruptions are a bigger driver of long cycle times than major breakdowns.
Unplanned Downtime and Maintenance Response
Equipment failure increases cycle time in two ways: the machine stops processing, and downstream flow becomes unstable after restart. Recovery often includes scrap checks, rebalancing labor, and clearing backed-up WIP, which means the loss continues after the machine is running again. This is why downtime and cycle time tracking should be reviewed together rather than in separate reports.
Rework, Quality Holds, and Inspection Queues
Poor first-pass yield extends cycle time because the same unit consumes capacity more than once. Rework loops, containment activity, and extra inspection all add time that is rarely visible in a simple output count. According to industry benchmarks, hidden factory costs linked to poor quality can reach 15% to 20% of sales in some manufacturing environments, and part of that cost shows up directly in longer lead and cycle times.
In an electronics factory, a failed functional test may send a batch back for solder touch-up, then back to test again, then into a hold area waiting for engineering disposition. The machine processing time may be unchanged, but actual cycle time expands because the product is trapped in exception handling. This is a good reminder that production cycle time is often driven by quality system friction, not only by production speed.
Approvals, Handoffs, and Shift-to-Shift Gaps
Some of the longest delays on the shop floor are administrative rather than mechanical. Waiting for first-article approval, deviation approval, maintenance release, or supervisor confirmation can keep material idle even when operators and machines are ready. These delays are especially common in regulated or high-mix environments where decisions are not standardized.
Shift handoffs create a similar effect. If downtime events, material shortages, or partially completed work orders are passed over verbally or on paper, the incoming shift may spend 15 to 30 minutes rechecking status before production resumes. Over a month, those routine handoff losses can have as much impact on cycle time reduction as a small equipment upgrade.
The Main Diagnostic Principle
If your cycle time is rising, do not assume the process itself has become slower. In many cases, the real causes are queues, interruptions, rework loops, and decision delays surrounding the process. The next step is to make those losses visible with better cycle time tracking so teams can separate true processing time from avoidable waiting and act on the right constraint.
How to Reduce Cycle Time With Better Tracking and Workflow Control
Standardize the Timestamps You Collect
You cannot improve the cycle time if different teams mark start and finish points differently. The first step is to define exactly which events count in your production cycle time: job released, material ready, setup complete, first piece started, operation completed, inspection cleared, and job closed. If one supervisor includes waiting time and another excludes it, the reported cycle time becomes unreliable even if the cycle time formula itself is correct.
In practice, plants should document timestamp rules by process family rather than rely on informal shop-floor habits. A CNC cell, SMT line, and manual assembly station often need different timestamp logic because loading, unloading, and inspection points are not the same. This also prevents confusion later when teams compare cycle time by machine, shift, or SKU and assume the data was captured under the same conditions.
Capture Cycle Time Data at the Source
Manual end-of-shift updates are one of the biggest reasons cycle time tracking fails. Operators, line leaders, and technicians should record events when the work happens, ideally through mobile forms, workstation tablets, barcode scans, or machine-connected triggers. Real-time capture reduces missed entries and makes it easier to separate true processing time from waiting, stoppages, and rework loops.
The biggest cycle time opportunities often sit outside pure machine run time. In many factories, operators can tell you a press cycle takes 40 seconds, but they cannot show how much extra time is lost waiting for material, quality release, tooling confirmation, or maintenance support. Source-level data closes that gap and gives production managers something they can act on during the shift, not after month-end reporting.
Track WIP Between Steps, Not Just Output
A line can hit its hourly output target and still hide poor cycle time performance if work-in-progress is piling up between operations. WIP tracking shows where units are spending time waiting, which is often more important than how fast an individual machine runs. Little’s Law is a useful reminder here: as WIP rises, average flow time usually rises as well unless throughput improves proportionally.
A simple example is an automotive subassembly line where stamping finishes parts quickly, but welding batches them before the next operation. Output may look acceptable at the end of the day, yet actual production cycle time stretches because parts sit in queues for hours. Tracking queue time between process steps makes the bottleneck visible and helps the team reduce cycle time through balancing, smaller batch sizes, or better dispatch rules.
Segment Cycle Time by Shift, SKU, and Machine
Average values hide operational variation. If you only review one overall cycle time number, you may miss that Line 2 on night shift runs 18% slower on high-mix SKUs, or that one machine family performs well on standard jobs but struggles after changeovers. Segmenting cycle time by shift, product code, machine, operator team, or order type turns a broad KPI into a practical management tool.
A line may appear to meet takt on average, while specific SKUs or shifts repeatedly exceed acceptable cycle thresholds. Segmented reporting helps you see whether the issue is labor allocation, setup discipline, material presentation, maintenance condition, or schedule sequencing.
Tag Delay Reasons So the Data Becomes Actionable
Cycle time data without reason codes often leads to guesswork. When an operation exceeds its target, the system should require a tagged cause such as material shortage, tool change, unplanned downtime, first-piece approval delay, rework, operator absence, or waiting for forklift service. Plants that use structured delay codes usually improve faster because they can separate chronic losses from isolated events.
Trigger Corrective Actions When Thresholds Are Exceeded
Good cycle time tracking should not stop at reporting. When cycle time exceeds a predefined threshold, the next action should be automatic: notify the line leader, open a maintenance ticket, escalate a material shortage, or require a supervisor review before the order moves forward. This closes the loop between measurement and response, which is where many spreadsheet-based systems break down.
A practical approach is to set threshold rules by process and product family instead of using one plant-wide trigger. A machining center with stable repeat jobs may justify a tight threshold, while a mixed-model assembly area may need wider control bands and different escalation paths. The goal is not to create more alerts, but to create faster intervention on the losses that materially affect throughput and delivery.
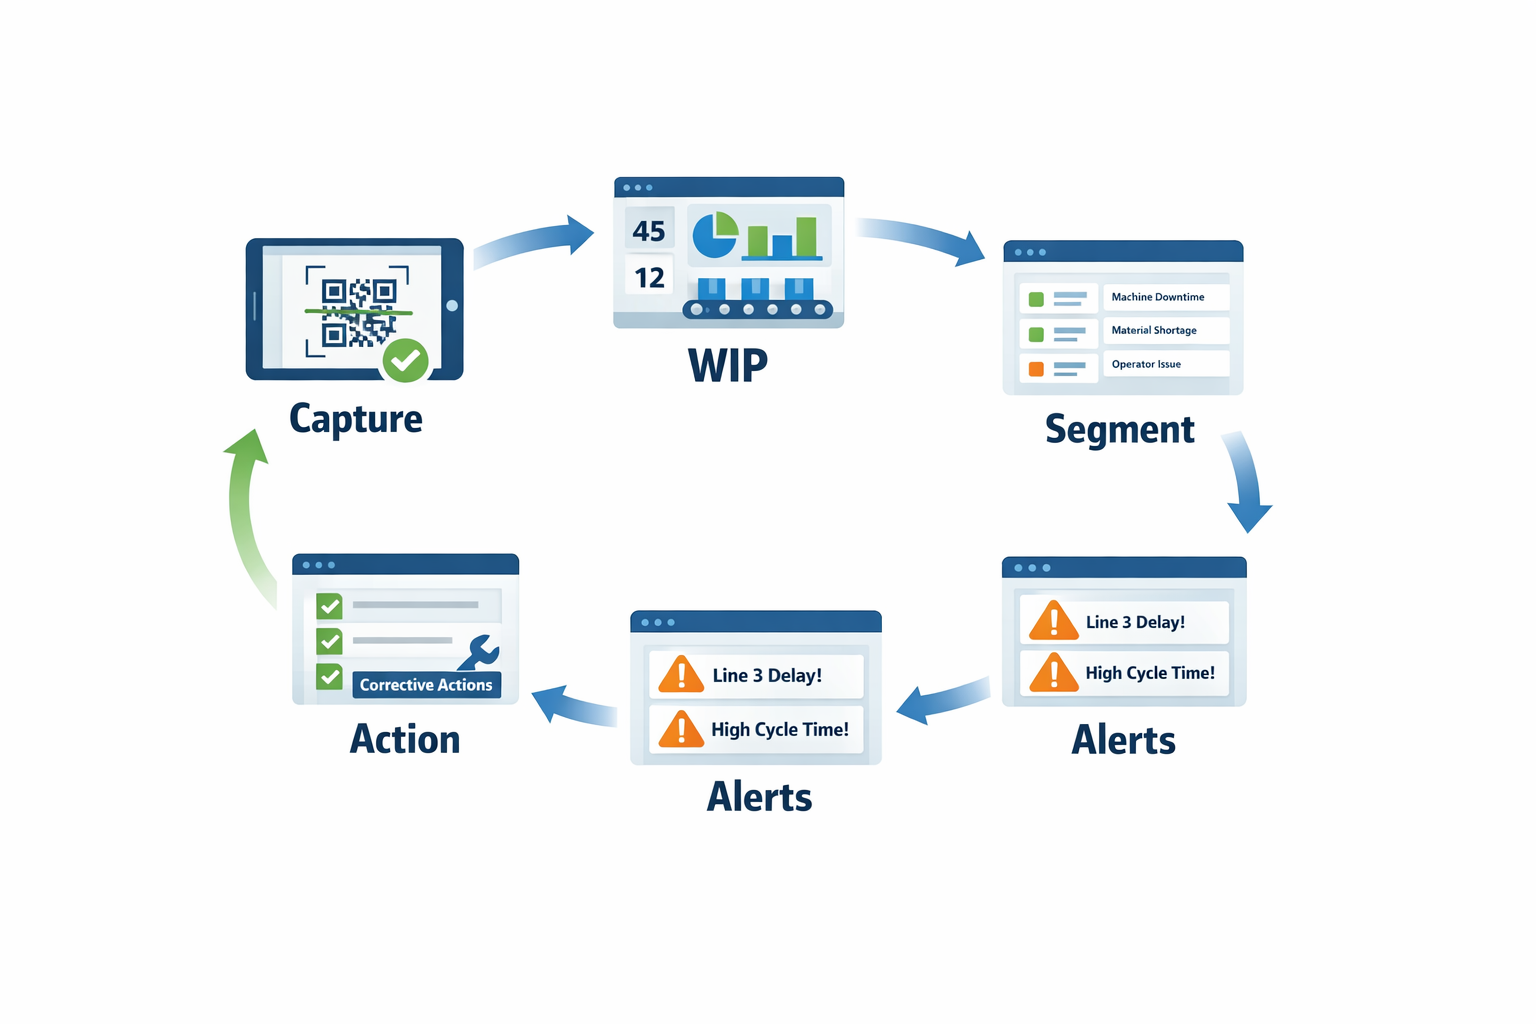
Replace Spreadsheet Tracking With a Digital Workflow
Once the plant has clear timestamp rules, WIP checkpoints, segmentation logic, and delay codes, the next challenge is execution discipline. At this stage, a no-code platform such as Jodoo can help operations teams replace spreadsheet-based tracking with digital forms, real-time dashboards, and workflow rules that match the actual production process. Instead of waiting for supervisors to compile data manually, teams can collect start/stop events at the source, visualize bottlenecks by line or SKU, and route abnormal delays to the right function immediately.
For example, an electronics plant can use Jodoo to let operators scan a work order when setup starts, log first-piece approval, record stop reasons during interruptions, and close each operation from a tablet on the line. If cycle time runs beyond the target for that SKU, Jodoo can trigger a workflow that alerts production and maintenance, assigns follow-up actions, and updates a dashboard for shift leaders in real time. That gives managers a practical way to move from passive reporting to closed-loop cycle time reduction without heavy custom development.
Conclusion: Turn Cycle Time Analysis Into Continuous Improvement
Cycle time becomes valuable only when your team uses one clear definition, applies the right formula at the right level, and acts on delays before they become normal. In practice, that means separating cycle time from takt time and lead time, calculating it consistently by process or work order, and tracing long cycle times back to real causes such as waiting, rework, downtime, changeovers, or approval gaps. For production and plant managers, the goal is not just better reporting—it is faster, more repeatable decisions on the shop floor.
That is why the strongest cycle time improvement efforts combine measurement with workflow discipline. When operators capture timestamps at the source, supervisors can segment performance by shift, machine, SKU, or order and respond to abnormal trends much earlier. Plants that build this closed loop typically improve both output stability and OEE, since cycle time loss is often tied directly to hidden stoppages and process variation.
If you want to digitize that process without heavy custom development, Jodoo gives you a practical no-code way to build cycle time tracking forms, delay reason workflows, real-time dashboards, and escalation alerts around your existing production process. You can start a free trial or book a demo to see how Jodoo fits your factory’s lean manufacturing workflow.