
Browse by category
Introduction: Why Takt Time Still Matters on Today’s Factory Floor
Even well-run factories lose output when production pace is based on habit instead of actual demand. In many plants, a few seconds of mismatch per unit can quietly turn into missed shipments, overtime, and excess WIP by the end of the week. That is why takt time still matters: it gives you a simple way to define the production pace required to meet customer demand within the time you actually have available.
For production managers, plant managers, lean managers, and industrial engineers, takt time remains one of the most practical lean metrics because it connects demand directly to line speed, staffing, and daily output expectations. It is not just a theoretical number for value stream maps. On the shop floor, it helps you see whether a line is running too slow to meet orders, too fast and building inventory, or unevenly across stations.
In this article, you will learn the takt time formula, how to do a reliable takt time calculation in manufacturing, and how to interpret the number in minutes or seconds per unit. We will also clarify takt time vs. cycle time, show realistic factory examples, and explain how digital tracking gives teams real-time visibility into production takt time instead of relying on delayed spreadsheet updates.
The Takt Time Formula and What the Numbers Really Mean
Takt Time Formula: Available Production Time ÷ Customer Demand
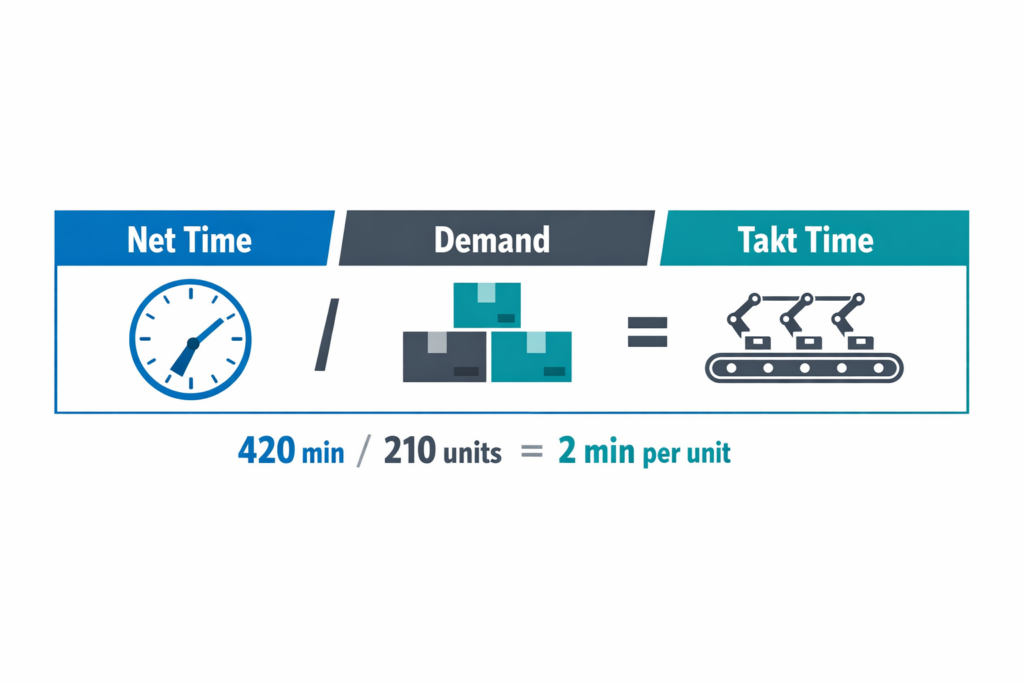
The takt time formula is simple: takt time = net available production time ÷ customer demand. The result tells you how much time the line can spend on one unit while still meeting demand for the period you are measuring. In practice, that period might be a shift, a day, or a week, but the numerator and denominator must use the same time window. If demand is daily, your available time must also be daily.
Many takt time calculations fail at this step. Teams often use an 8-hour shift as the numerator, even though operators are not producing for all 480 minutes. They may also divide by a monthly forecast while using one shift’s time, which produces a number that looks precise but is operationally meaningless.
What Counts as Available Production Time
Available production time should mean net production time, not total clock time. Start with scheduled time, then subtract planned breaks, shift handover, routine cleaning, team meetings, and any other time when the line is not expected to produce saleable units. If a machine is intentionally stopped for preventive maintenance during the measured window, that planned stoppage should also be excluded.
For example, if a line is scheduled for 480 minutes, with 30 minutes for lunch, 10 minutes for a shift meeting, and 20 minutes for planned cleaning, the net available time is 420 minutes. That 420-minute figure is the right numerator for the takt time formula, not 480. Using gross shift hours would overstate line capacity by 14.3%, which can distort staffing, balancing, and output targets.
Use the Right Demand Number
The denominator should reflect actual customer demand for the same period. If you are calculating daily production takt time for final assembly, use the confirmed daily requirement that the line must ship or replenish. If demand changes by model, family, or line, calculate takt at the level where the work is actually scheduled and managed.
A common mistake in lean manufacturing takt analysis is using a weekly or monthly average that hides daily variation. Suppose average demand is 1,000 units per week, but customer pull is front-loaded and requires 250 units on Monday and 150 on Friday. A single average takt may look acceptable on paper while the line misses the real required pace early in the week.
Keep Units Consistent
Takt time can be expressed in seconds per unit, minutes per unit, or, less commonly, hours per unit. The key is consistency. If your available time is in minutes, demand must be in units for that same period, and your result will be minutes per unit.
On most shop floors, seconds per unit are easier for line balancing and operator work allocation. For higher-level planning, minutes per unit may be more readable. Either works, as long as everyone from production supervisors to industrial engineers is reading the same unit of measure.
Why Planned Losses Matter More Than Most Teams Think
Planned non-production time is not a minor accounting detail; it changes the target pace operators are expected to hold. If you ignore planned stoppages, the takt target becomes artificially tight or artificially loose depending on what was left in the numerator. That can lead to the wrong conclusion about whether the line is underperforming or whether demand simply exceeds realistic capacity.
This is also why takt time should not be confused with uptime or equipment efficiency. Takt sets the required production rhythm based on demand and usable time. Comparing takt time with cycle time then shows whether the process is actually capable of meeting that required rhythm.
Three Common Errors That Make Takt Time Misleading
The first error is using gross shift hours instead of net available time. This makes the takt number look more generous than reality and can hide the need for extra labor, overtime, or balancing changes. It is one of the fastest ways to create a production plan that the line cannot sustain.
The second error is using forecast demand instead of true required demand. Forecasts are useful for capacity planning, but the takt time used for daily execution should reflect the demand signal the factory is actually expected to satisfy. Otherwise, the line may chase the wrong pace and create avoidable shortages or excess inventory.
The third error is using the wrong numerator or denominator level. For example, calculating takt for a full plant but applying it to one constrained assembly line will give the wrong target. In the same way, using total line time but demand for only one product family creates a false takt time example that does not match how work is released on the floor.
How to Calculate Takt Time in Manufacturing, Step by Step
Step 1: Define the Time Window You Are Planning For
Start with the specific planning window your team actually manages: one shift, one day, or one customer schedule bucket. A takt time calculation only works if the time base matches the demand signal, so avoid mixing daily demand with weekly available time. For most production managers, one shift or one day is the most practical starting point because it aligns with staffing, break schedules, and line reporting.
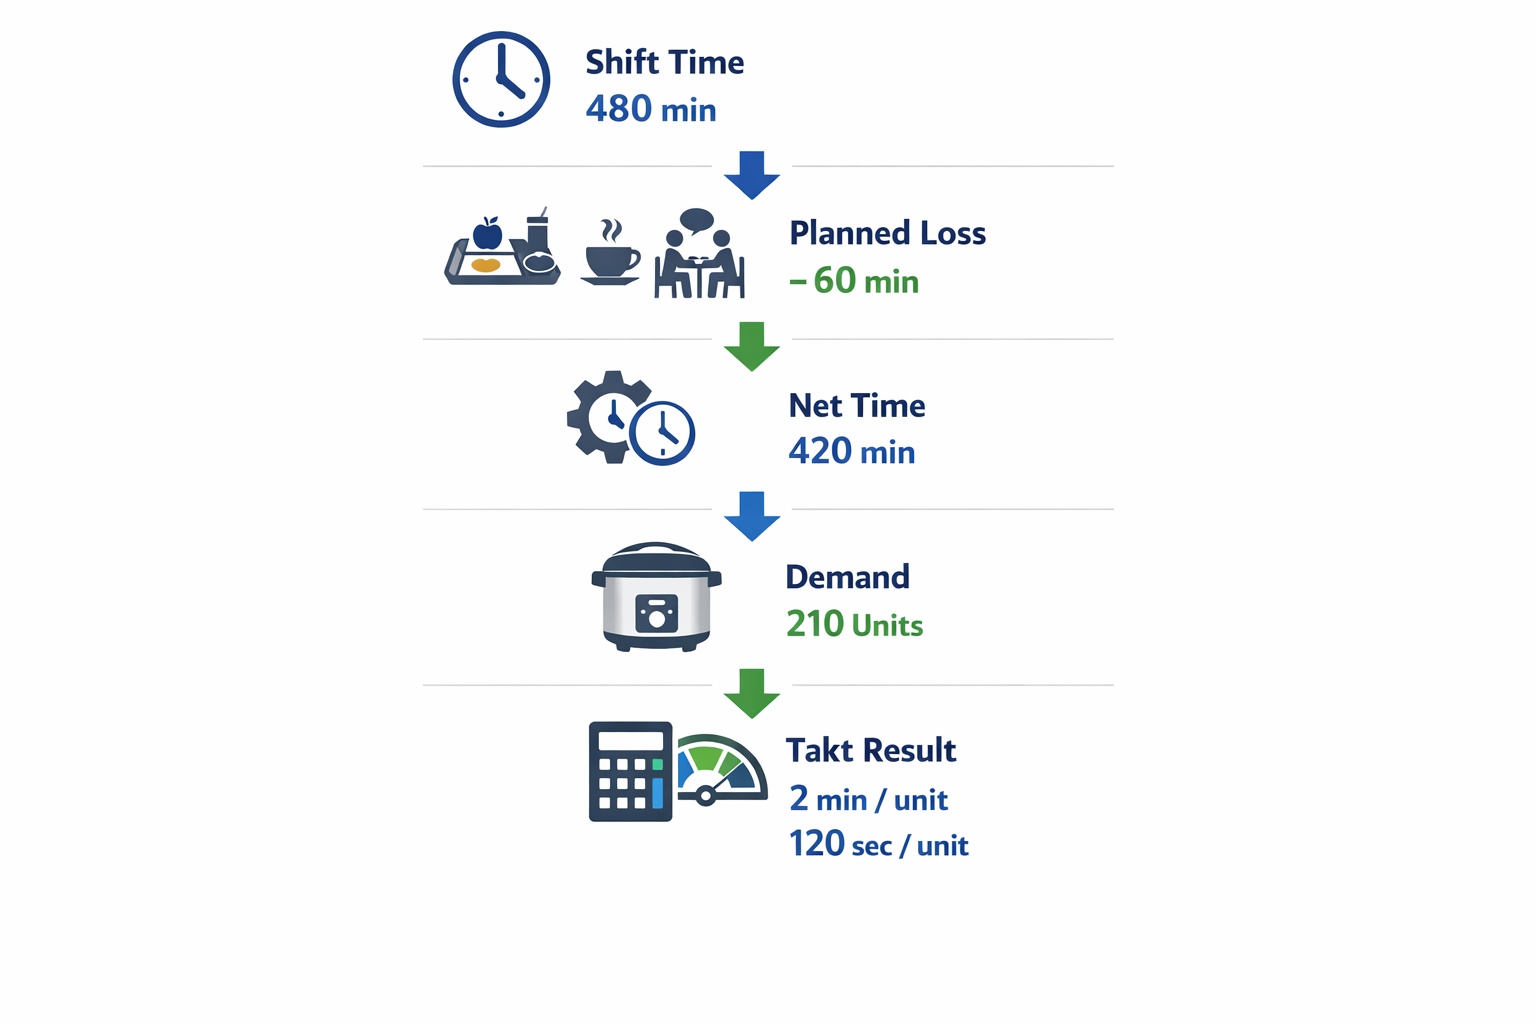
Take a discrete manufacturing example: an appliance plant assembling electric rice cookers on one final assembly line. The line runs one 8-hour shift, so the gross available time looks like 480 minutes. At this stage, that is only a starting number, not yet the true production takt time.
Step 2: Subtract Planned Non-Production Time
Next, remove all time that is intentionally unavailable for production. This includes meal breaks, tea breaks, shift handovers, planned cleaning, and scheduled team meetings. In lean manufacturing, takt time should be based on net available production time, not gross shift length, or the result will be too optimistic.
In the rice cooker line, the 480-minute shift includes a 30-minute lunch break, two 10-minute breaks, and a 10-minute startup meeting. That means planned non-production time totals 60 minutes, leaving 420 minutes of net available time. If you stopped here and used 420 minutes, your takt time formula would already be much more reliable than using the full 480.
Step 3: Confirm Actual Customer Demand for the Same Period
Now verify the required output for that same time window. Use confirmed customer demand, shipping requirement, or the frozen production plan that the line is expected to meet. Do not switch to a monthly forecast if the line is being scheduled and measured daily, because that distorts the takt target.
For the same rice cooker line, assume the initial plan says the factory must produce 210 units today. With 420 minutes available and 210 units required, the takt time calculation becomes 420 ÷ 210 = 2 minutes per unit, or 120 seconds per unit. This is a useful first takt time example because it gives supervisors a clear target pace for the line.
Step 4: Recheck Capacity Losses That Affect the Real Plan
Before locking the number into daily management, review whether any additional planned constraints should be reflected in the available time. This is where production teams often discover that a line will lose time to a scheduled material replenishment stop, first-piece inspection, or change in manpower. These are not random downtime events; they are known conditions that affect the day’s true capacity.
In our example, the line also has a 20-minute planned first-article verification and changeover adjustment for a packaging variation. That reduces net available time from 420 minutes to 400 minutes. With demand still at 210 units, the revised production takt time is now 400 ÷ 210 = 1.90 minutes per unit, or about 114 seconds per unit.
Step 5: Update the Takt When Demand Changes
Takt time is not a fixed engineering constant. It changes when customer demand changes, even if the line and staffing stay the same. That is why teams should recalculate it whenever there is a meaningful update to the production schedule.
Suppose sales revises the requirement upward to 250 units for the same shift, while available production time remains 400 minutes. The new takt time formula is 400 ÷ 250 = 1.6 minutes per unit, or 96 seconds per unit. The line has not become faster on its own; the required pace has simply become tighter.
Step 6: Interpret the Result in Shop-Floor Terms
Once you calculate takt time, translate it into a pace the line can act on. Minutes per unit are useful for planning, but seconds per unit are often easier for team leaders, industrial engineers, and line operators to visualize. On faster assembly lines, even a 10- to 15-second gap matters, so expressing takt in seconds helps daily management.
In the rice cooker example, the line moved from an early rough assumption of 480 ÷ 210 = 2.29 minutes per unit to a more accurate figure of 96 to 114 seconds per unit, depending on confirmed demand and planned available time. That difference is large enough to affect staffing, balance charts, and hourly output targets. A good takt time calculation is not just arithmetic; it is the basis for a realistic production pace.
Takt Time Example Scenarios Across Different Production Environments
Automotive Assembly: Stable Demand, Tight Repetition
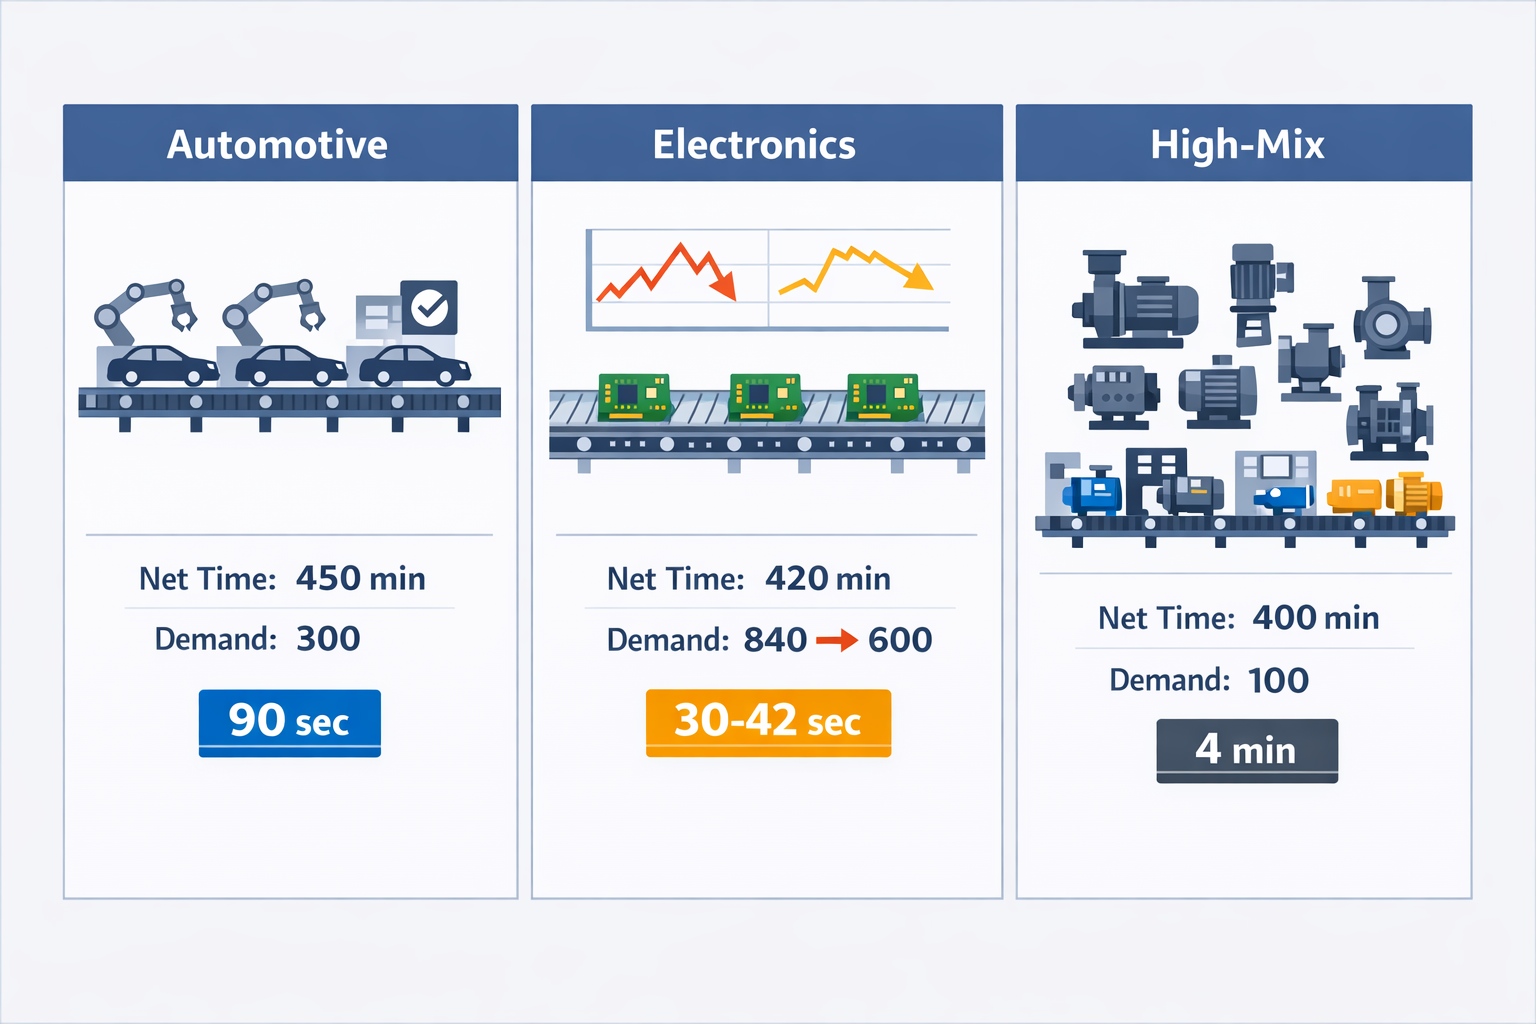
In automotive assembly, takt time is often easiest to visualize because demand is relatively stable and work content is highly standardized. Suppose a final assembly line has 450 minutes of net available production time in a shift, and customer demand for that shift is 300 vehicles. The takt time calculation is 450 ÷ 300 = 1.5 minutes per vehicle, or 90 seconds per unit.
This kind of production takt time gives managers a clear line-balancing target. If each workstation can consistently complete its assigned work within about 90 seconds, the line can meet demand without building excess WIP between stations. In lean manufacturing, takt time in this environment is less about complex math and more about maintaining repeatable flow, standard work, and fast response when one station starts slipping.
Electronics Assembly: Demand Changes Faster Than the Line Setup
Electronics plants often face shorter product life cycles and more volatile order patterns, so the takt target can move more frequently. For example, an SMT-to-manual-assembly line may have 420 minutes of net available time and a daily demand of 840 control boards, giving a takt time of 30 seconds per board. If the next day’s confirmed demand drops to 600 boards, the takt immediately changes to 42 seconds per board.
That shift matters operationally because the required output pace changes even if the equipment and operators do not. A takt time example like this shows why teams should base the numerator on real available time and the denominator on confirmed demand, not weekly averages. Otherwise, managers may overstaff, run the line too aggressively, or misread whether actual output is truly on pace.
High-Mix Discrete Manufacturing: One Takt, Many Product Variants
High-mix environments make takt time more difficult because customer demand must be translated into a workable pacing rule across different SKUs. Imagine a factory assembling industrial pump variants with 400 minutes of available time and a total daily demand of 100 units across eight models. The overall takt time formula still gives 4 minutes per unit, but the challenge is that one variant may take 2.5 minutes to assemble while another takes 6 minutes.
Here, takt time is still useful, but only if managers apply it at the right level. The takt target helps set the overall required pace for the line or value stream, while scheduling, line balancing, and work allocation must absorb model-to-model variation. This is where a simple takt time calculation stops being enough on its own, because the factory also needs production leveling (heijunka), flexible staffing, or pre-assembly strategies to keep the average output aligned with demand.
What These Examples Show in Practice
These three scenarios show that the same formula can support very different production realities. In automotive, takt time supports stable repetitive flow; in electronics, it shifts quickly with order volume; and in high-mix manufacturing, it sets the overall pace but must be paired with stronger scheduling discipline. The next step is to compare takt time vs cycle time, because that is where managers can see whether the line is actually capable of keeping up with the required pace.
Takt Time vs. Cycle Time: How to Spot Gaps, Bottlenecks, and Capacity Risks
Takt Time Sets the Target; Cycle Time Shows Actual Pace
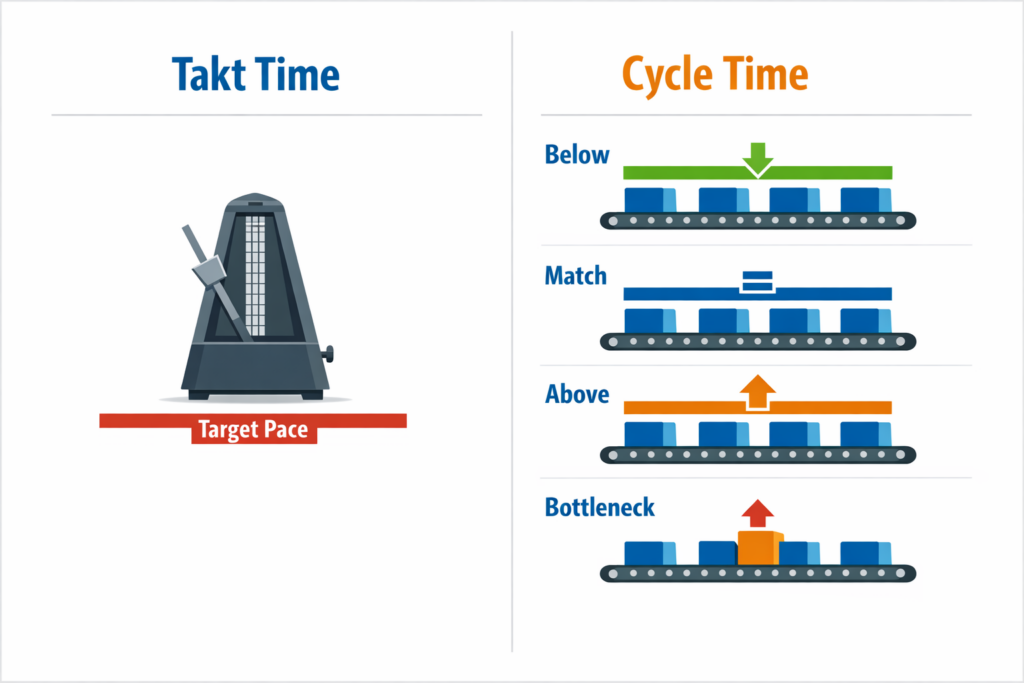
In practice, takt time vs cycle time comes down to one simple question: How fast do we need to produce, and how fast are we actually producing? Takt time is the required pace based on customer demand, using the same logic established in the earlier takt time formula and takt time calculation. Cycle time is the actual time needed to complete one unit, one station task, or one process step, depending on what you are measuring.
This distinction matters because a line can look busy while still missing demand. If your production takt time is 60 seconds per unit but the bottleneck station runs at 72 seconds per unit, output will fall behind even if operators stay fully occupied. In lean manufacturing, takt time is the demand signal, while cycle time is the execution reality.
What the Relationship Tells You
When cycle time is lower than takt time, the process has some capacity margin. That does not automatically mean the line is optimized, because excess capacity may be unevenly distributed across stations. One process may have spare time while another is overloaded, creating hidden imbalance and unnecessary WIP.
When cycle time is equal to takt time, the process is aligned to demand, at least under normal conditions. This is usually the design point for stable flow lines, but it leaves little room for minor stoppages, material delays, or changeovers. A line running exactly at takt on paper can still miss the plan in real production if availability is unstable.
When cycle time is higher than takt time, you have a clear capacity risk. For example, if a packaging cell must meet a takt of 45 seconds but averages 52 seconds, it will miss roughly 1 unit every 6 to 7 cycles. Over an 8-hour shift, that small gap can translate into dozens of units lost.
How to Use Takt and Cycle Time for Line Balancing
Line balancing starts by comparing each station’s cycle time with takt, not by looking only at total line output. In a consumer appliance assembly line, final inspection may run at 40 seconds, subassembly at 43 seconds, and screw-fastening at 58 seconds against a takt of 50 seconds. The line’s true pace is limited by screw-fastening, not by the average across all stations.
This is why managers should review cycle time at the station level during balancing exercises. If one station exceeds takt while others sit well below it, the fix may be as simple as redistributing work content, changing fixture layout, or moving one task upstream. A good takt time example here is a line that improves output without adding headcount simply by shifting 8 seconds of manual work away from the constraint station.
How Staffing Decisions Should Follow the Gap
Staffing should be tied to the gap between takt and cycle time, especially in manual or semi-automated processes. If a kitting area has a takt of 90 seconds but the actual cycle time is 110 seconds, the team is structurally under-capacity for current demand. In that case, overtime may protect one shift, but it does not solve the underlying mismatch.
A better response is to test whether the gap comes from labor content, layout, motion waste, or replenishment delays. In some cases, one additional operator on peak demand windows is justified; in others, a revised work combination sheet can bring cycle time back under takt without extra labor. The key is to use measured cycle data rather than assumptions about operator effort.
How to Identify the Real Bottleneck
A bottleneck is the step with the longest effective cycle time after accounting for actual operating conditions. That matters because the slowest process may not be the one with the longest manual task time; it may be the machine with repeated micro-stops, slow resets, or unstable yield. Looking only at standard cycle time can hide the process that is really limiting throughput.
Consider a machining line with a takt of 75 seconds. Machine A is rated at 68 seconds, Machine B at 70 seconds, and Machine C at 72 seconds, but Machine B has frequent tool-change interruptions that push its effective cycle to 82 seconds over the shift. On paper, the line appears capable, but in operation, Machine B becomes the true capacity constraint.
What to Do When Cycle Time Falls Behind Takt
When actual cycle time moves above takt, the response should be immediate and structured. First, confirm whether the issue is localized to one station, one shift, one product family, or one equipment condition. Then separate short-term containment from permanent correction so teams do not treat every miss as a staffing problem.
A practical sequence is to: review the station with the largest gap, check downtime and waiting losses, confirm material availability, and compare actual work content against the standard. If the gap is temporary, such as a feeder jam or missing components, supervisors should restore flow quickly and track recovery time. If the gap is persistent, the issue belongs in structured problem-solving, line rebalancing, or capacity planning.
How This Supports Daily Management
For daily management, takt time should function as the operating reference and cycle time as the control signal. Supervisors do not need to recalculate the full takt time formula every hour, but they do need to know when actual pace drifts beyond the required pace. That is what turns takt from a planning metric into a live management tool.
On the shop floor, this usually means reviewing plan-versus-actual output by interval, checking station-level cycle trends, and escalating abnormal gaps early in the shift. A line producing medical device trays at takt for the first two hours but slipping 10% after lunch may be signaling fatigue, replenishment delays, or changeover losses that would be invisible in end-of-day reporting. Used this way, the comparison between takt time and cycle time becomes a practical method for spotting bottlenecks before they become missed shipments.
Conclusion: How to Track Takt Time Digitally
Takt time is most valuable when it becomes a live operating signal, not a number updated once a week in a spreadsheet. On the factory floor, demand changes, minor stops accumulate, and cycle time can drift above the required pace within a single shift. That is why effective takt management depends on real-time production reporting, downtime capture, digital work orders, and dashboards that show whether each line is staying on target.
With Jodoo, manufacturers can build no-code workflows to track production takt time without waiting for custom software development. A team can set up mobile forms for hourly output reporting, log downtime by reason code, trigger alerts when actual cycle time exceeds takt, and display line-level status on live dashboards for supervisors and plant managers. This makes it easier to move from lean analysis to daily control and faster response.
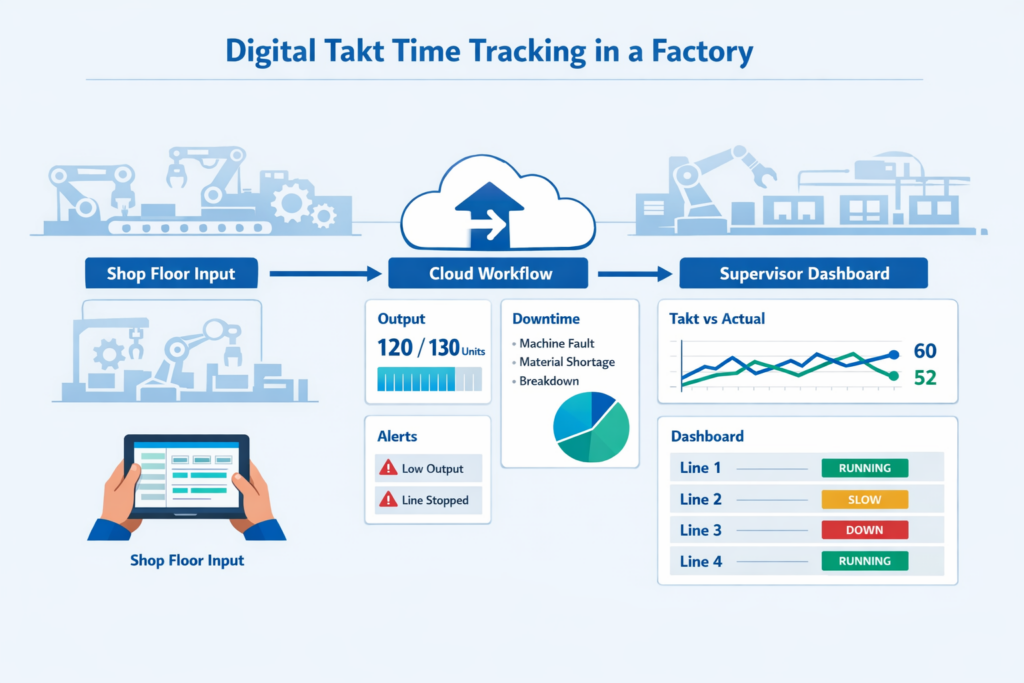
For example, an electronics plant can use Jodoo to collect shift data from tablets at each station and send alerts when output falls behind demand. Supervisors see the gap immediately, trace whether the cause is changeover, material shortage, or equipment stoppage, and act before the delay affects the full day’s schedule.
If you want to digitize lean manufacturing workflows and make takt time easier to track in real operations, Jodoo is a practical place to start. Start a free trial or book a demo to see how a no-code system can fit your plant’s process.